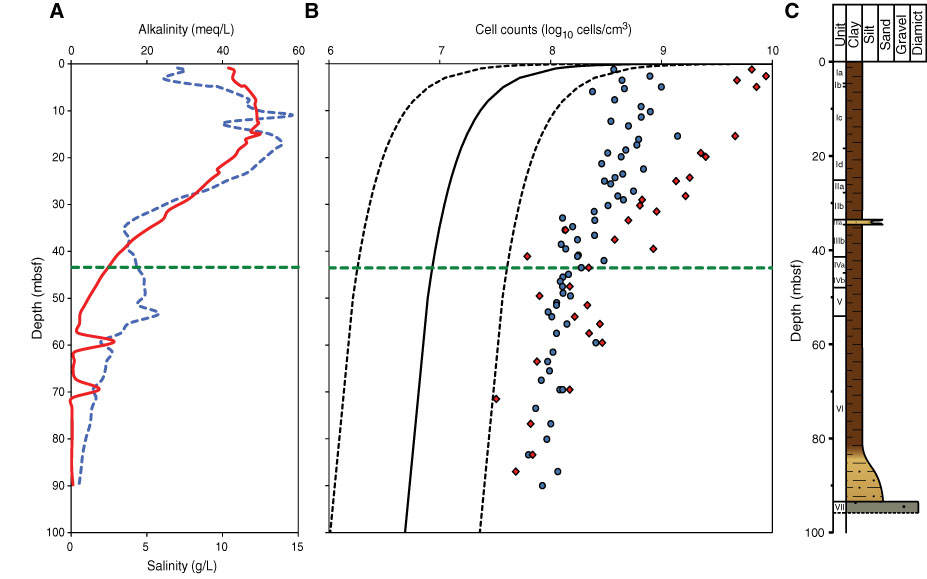
Figure F23. Plot of microbial cell abundances compared to chemical zonation and lithostratigraphy, Hole M0063E. A. Interstitial water alkalinity (blue dashed line) and salinity (red line). Green dashed line = depth below which both cell counting techniques yield similar results. B. Cell numbers obtained by flow cytometry (blue circles) and acridine orange direct count (red diamonds). Solid black line = global regression line of prokaryote cell numbers with depth, dashed lines = upper and lower 95% prediction limits for regression line (Roussel et al., 2008). Green dashed line = depth below which both cell counting techniques yield similar results. C. Lithology.
Previous | Close | Next | Top of page