Previous | Close | Next
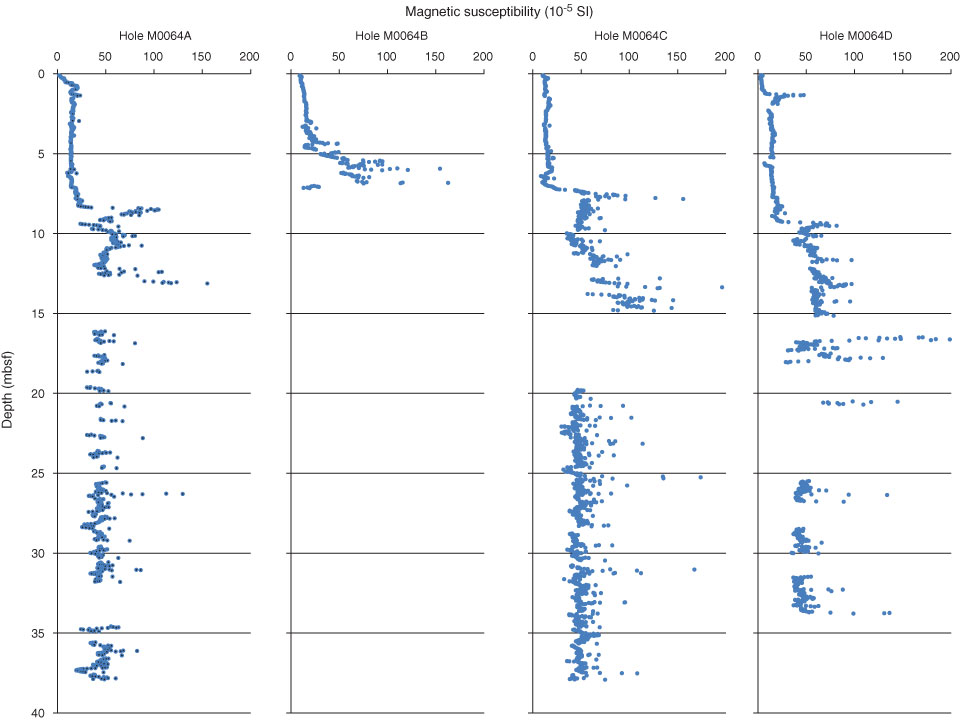
Figure F15. Plot of magnetic susceptibility (10–5 SI) data, Holes M0064A–M0064D.
Previous | Close | Next | Top of page