Previous | Close | Next
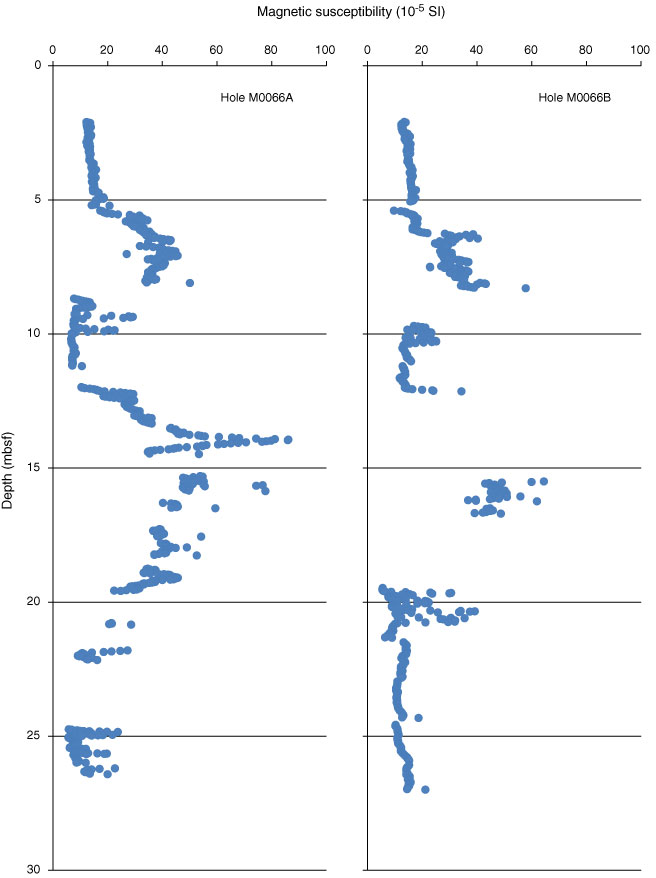
Figure F13. Plot of magnetic susceptibility from shipboard generated MSCL data, Holes M0066A and M0066B.
Previous | Close | Next | Top of page