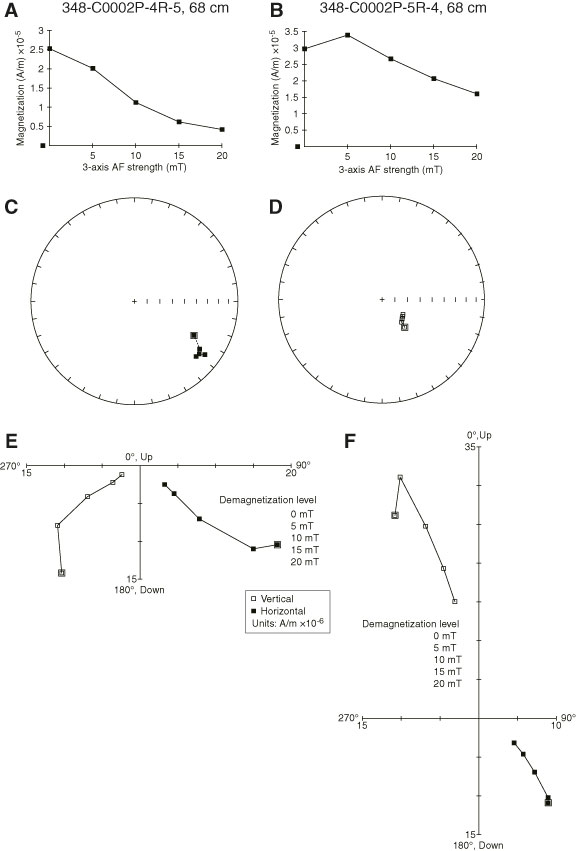
Figure F11. A, B. Normalized change in intensity. C, D. Lower hemisphere equal area projection. E, F. Progressive alternating field (AF) demagnetization displayed by vector endpoint diagram. Data points = magnetization vector for individual demagnetization steps projected onto horizontal and vertical plane. Figures were prepared with PuffinPlot (Lurcock and Wilson, 2012).
Previous | Close | Next | Top of page