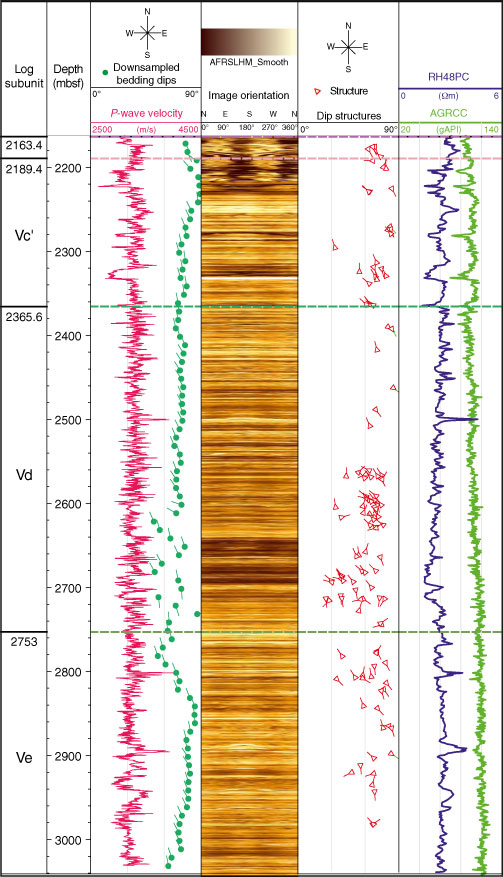
Figure F21. Summary of the preliminary interpretation of azimuthal focused resistivity (AFR) images displayed with velocity, resistivity (RH48PC), and gamma radioactivity (AGRCC). Tadpole plot of downsampled bedding dips (interval = 30 m, step = 15) and shipboard P-wave velocity, high-resolution AFR image (static processing), tadpole plot of structures, resistivity, and gamma ray logs.
Previous | Close | Next | Top of page