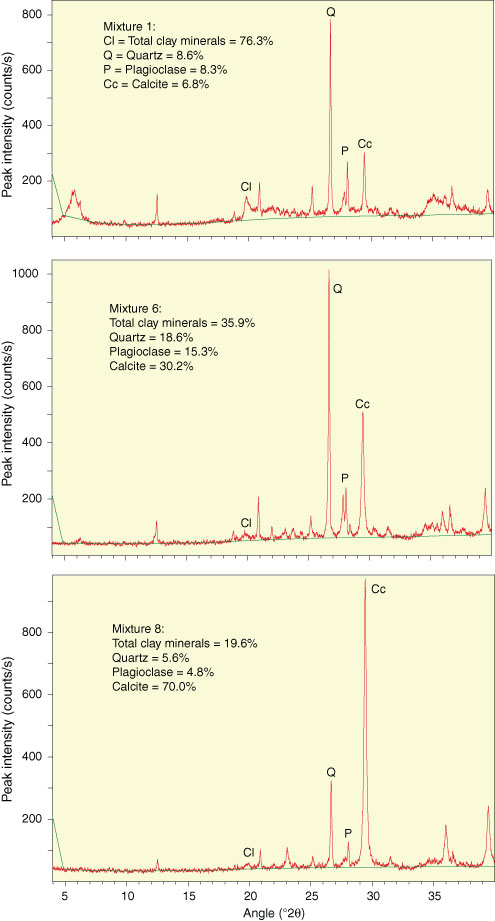
Figure F6. Examples of X-ray diffractograms for mixtures of standard minerals showing the positions of diagnostic peaks used to calculate relative mineral abundance, Expedition 348. Green line represents baseline subtraction.
Previous | Close | Next | Top of page