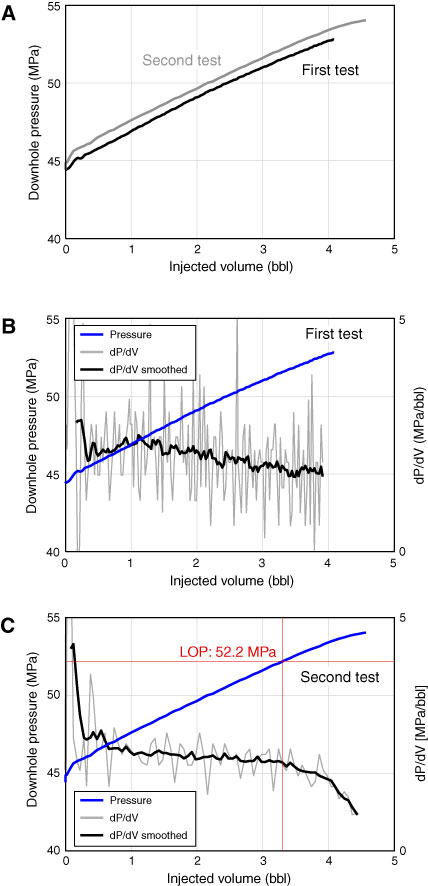
Figure F109. Downhole pressure versus injected volume data, Hole C0002P. A. Comparison between the two tests. B. Downhole pressure and pressure build-up rate data from the first test. C. Downhole pressure and pressure build-up rate data from the second test. Gray curve is the full data set; black curve is smoothed by a moving average over 15 samples, and blue is the downhole pressure. LOP = leak-off point.
Previous | Close | Next | Top of page