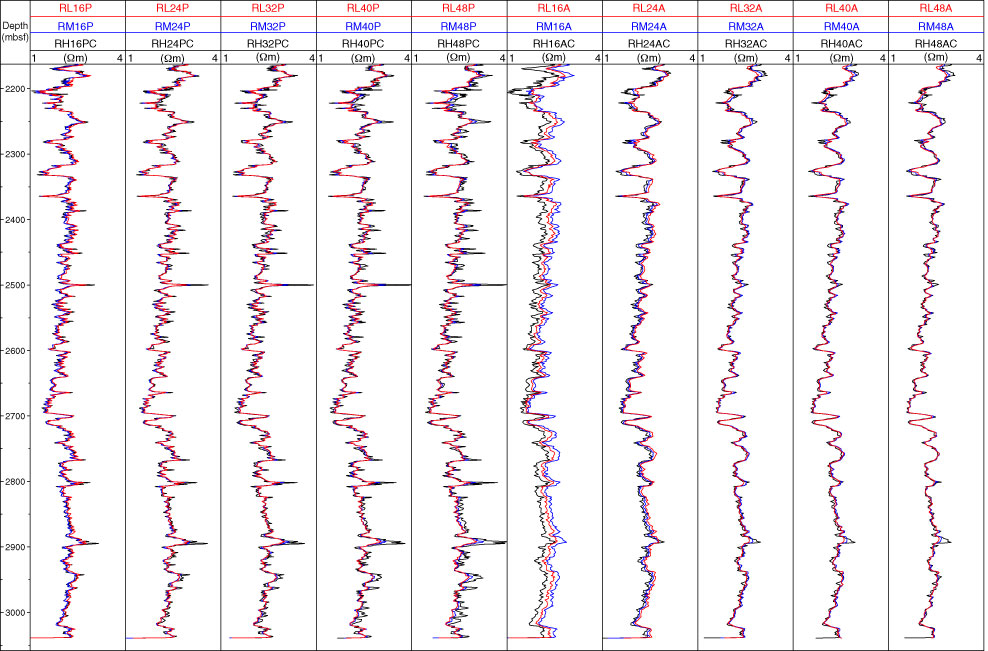
Figure F115. Resistivity data collected using the EWR-M5 tool, Hole C0002P. Each column represents resistivity data from either phase-shift (P) or attenuation (A) resistivity measured using one of the sensor spacings (16, 24, 32, 40, or 48 inch). Black (H) = 2 MHz, blue (M) = 500 kHz, red (L) = 250 kHz. Low-frequency data shows lower resolution than the higher frequency data.
Previous | Close | Next | Top of page