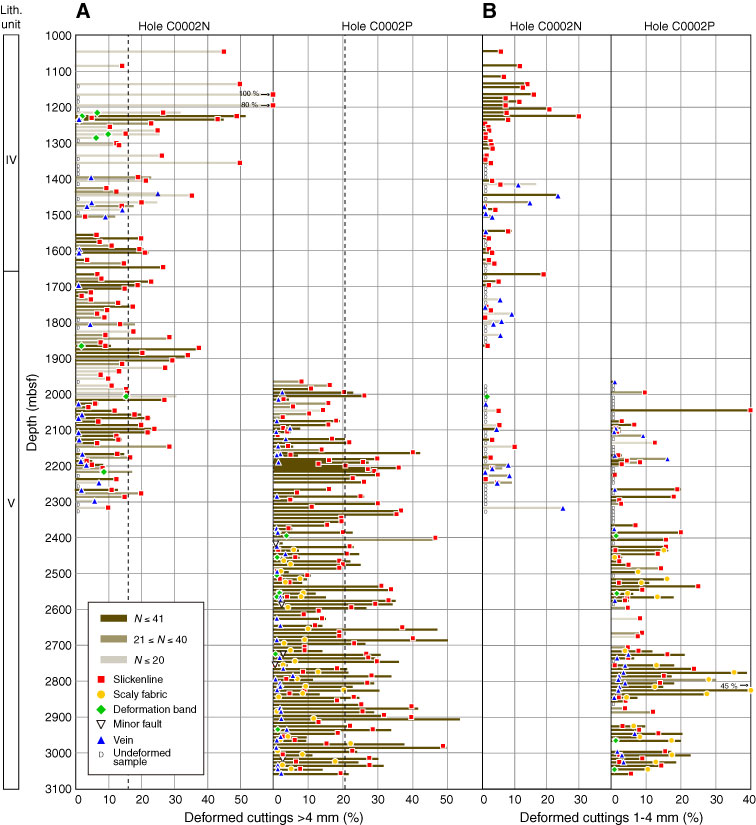
Figure F29. A, B. Depth distribution of percentage of deformation structures in intact cutting samples, Holes C0002N and C0002P. For each depth, this percentage is obtained by dividing the number of cuttings that show any deformation structures by the number of investigated cuttings. In turn, the relative contribution of slickenlines, veins, deformation bands, scaly fabric, and minor faults is represented as a percentage of the deformed cuttings along the bar that represents each sample. Dashed line is the mean value of percentage of deformation structures calculated from samples with >20 cuttings of retrieved intact cuttings (16% for Hole C0002N and 21% for Hole C0002P).
Previous | Close | Next | Top of page