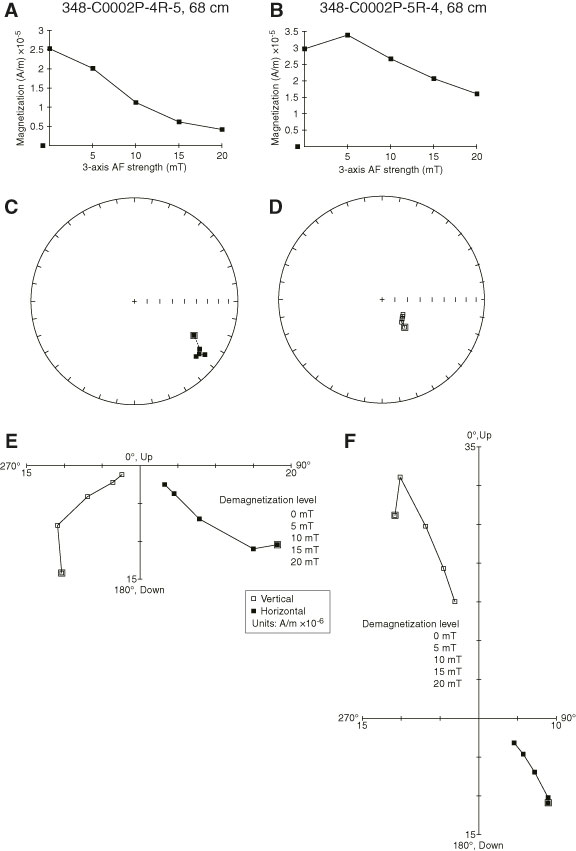
Figure F50. A, B. Normalized change in intensity of magnetization. C, D. Stereoplot diagrams showing remanent magnetization. Solid and open squares correspond to the lower and upper hemisphere equal area projection, respectively. E, F. Progressive alternating field demagnetization (AFD) displayed by vector endpoint diagrams. Data points = magnetization vector for individual demagnetization steps projected onto horizontal (solid squares) and vertical (open squares) plane. Figures were prepared with PuffinPlot (Lurcock and Wilson, 2012).
Previous | Close | Next | Top of page