Previous | Close | Next
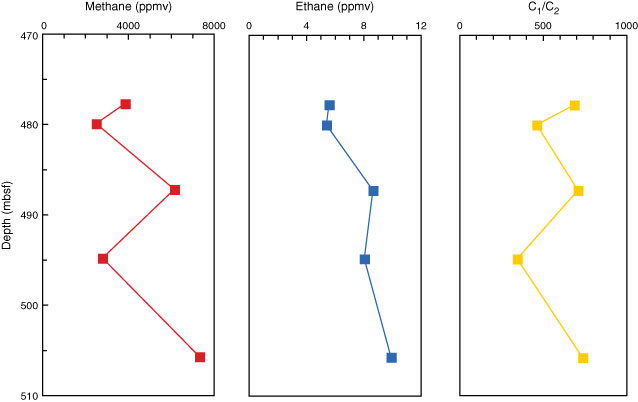
Figure F54. Variations in methane (C1) and ethane (C2) concentrations with depth, Hole C0002M.
Previous | Close | Next | Top of page