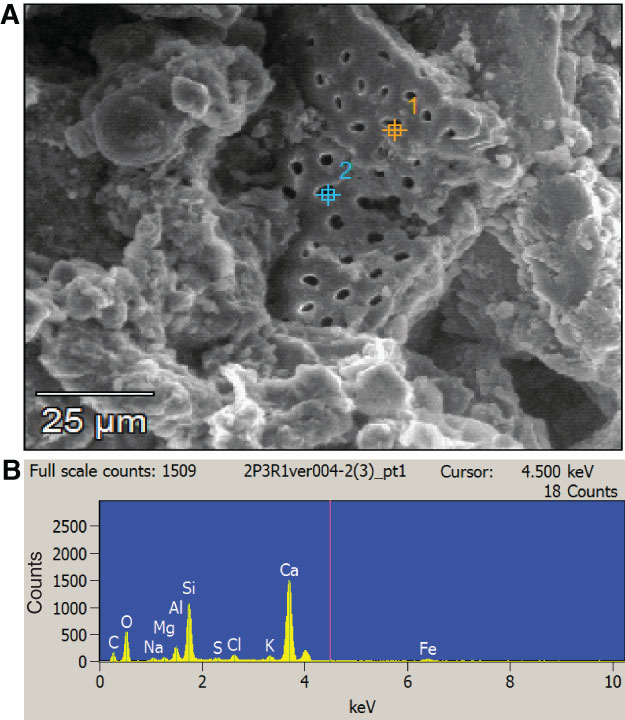
Figure AF5. Documentation of microfossils in a specimen cut from Sample 348-C0002P-3R-1, 51 cm. A. ESEM image used for EDS analysis. B. EDS spectrum of major elements from Point 1 in B. Point 2 yielded similar results. Elemental spectrum is consistent with the composition of calcite (CaCO3).