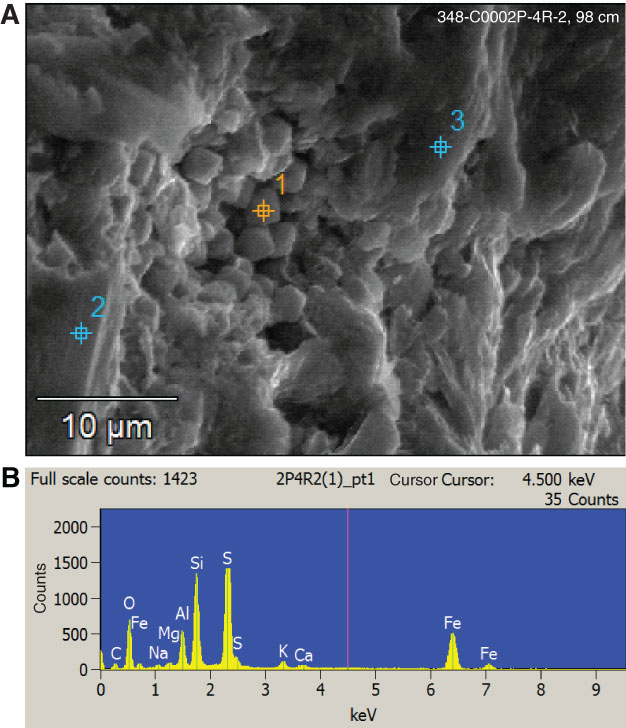
Figure AF7. Documentation of pyrite in the specimen cut from Sample 348-C0002P-4R-2, 98 cm. A. ESEM image used for EDS analysis. B. EDS spectrum of major elements from Point 1 in A. Points 2 and 3 were used for comparison of spectra with typical silicate minerals. Elemental spectrum is consistent with the composition of pyrite (FeS2).
Previous | Close | Top of page