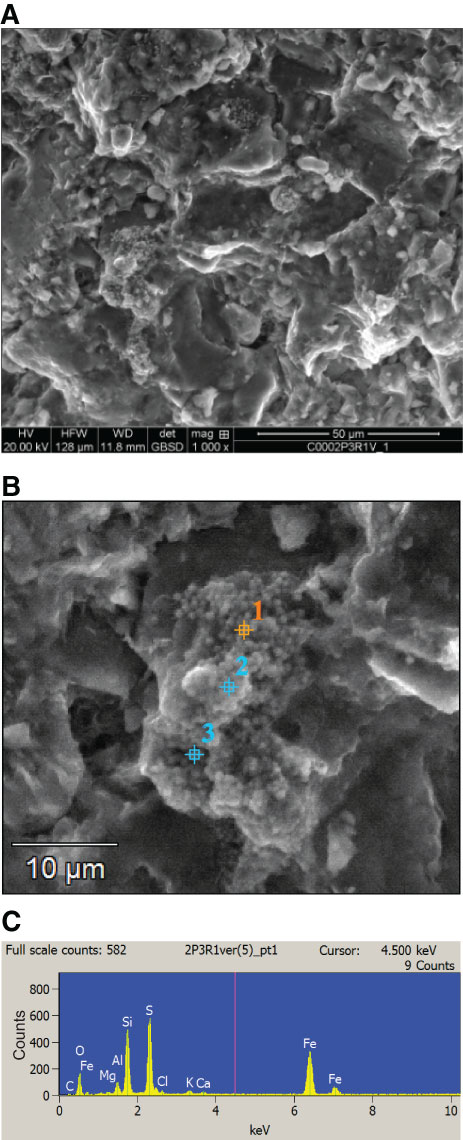
Figure F10. Pyrite framboid in Sample 348-C0002P-3R-1, 51 cm. A. ESEM image. B. Image used for EDS analysis. C. EDS spectrum of major elements from Point 1 in B. Points 2 and 3 yielded similar results. Elemental spectrum is consistent with the composition of pyrite (FeS2) with traces of clay minerals.
Previous | Close | Next | Top of page