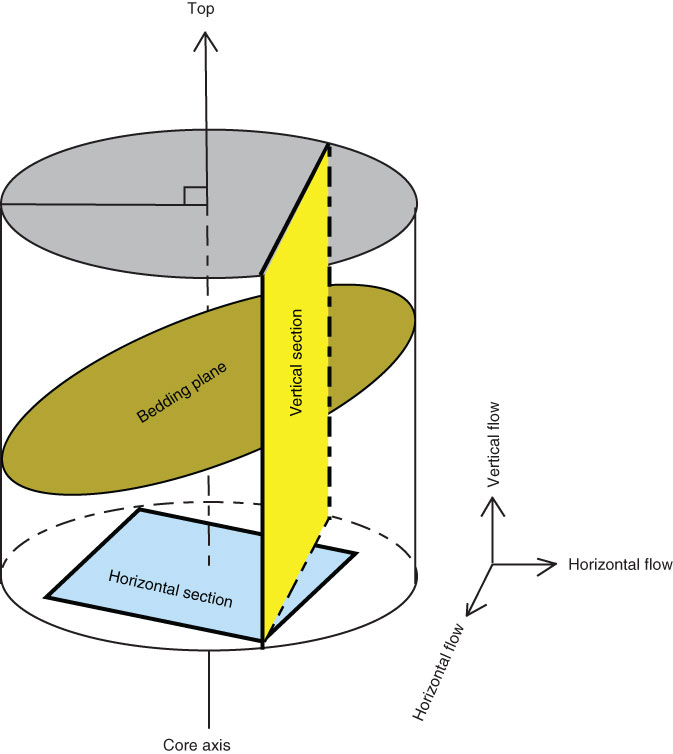
Figure F6. Schematic showing geometric relations among bedding, orientation of the core axis, and the horizontal and vertical sections used for imaging by ESEM. All specimens tested in this study display bedding dips >80°.
Previous | Close | Next | Top of page