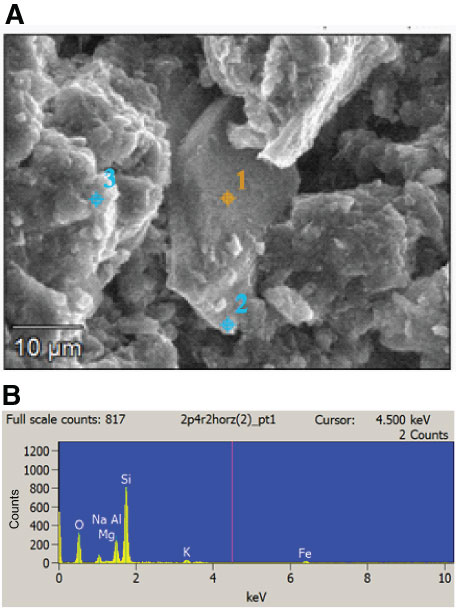
Figure F8. A. ESEM image of Sample 368-C0002P-4R-2, 98 cm. B. Spectrum of major elements from energy dispersive X-ray spectroscopy from Point 1 in A. Elemental spectrum is consistent with the composition of quartz (SiO2) with traces of clay minerals.
Previous | Close | Next | Top of page