Next Section | Table of Contents
doi:10.2204/iodp.sp.308.2005
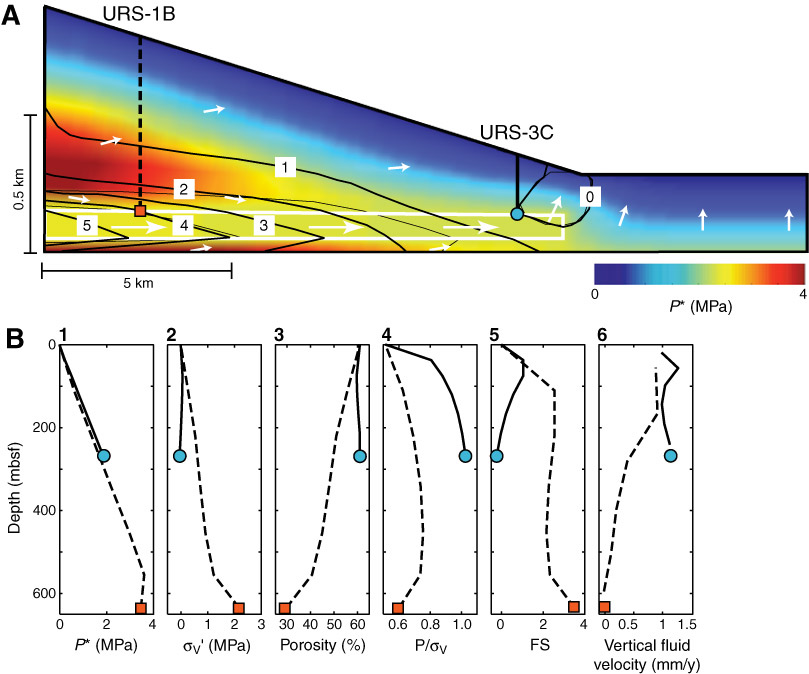
Figure F2. A. Low-permeability sediments are rapidly deposited on a high-permeability aquifer (outlined in white). The sedimentation rate decreases from left to right, resulting in the final wedge-shaped geometry. Rapid sedimentation generates overpressures (P*, color contours) that are greatest on the left (red). Flow is driven laterally (left to right) along the aquifer and expelled at the toe of the slope where the aquifer ends (white arrows). The vertical effective stress (black contours) is a minimum on the right end of the aquifer. B. Model predictions for URS-1B (dashed line in A and B) and URS-3C (solid line in A and B); drilling and measurement will provide direct tests of these predictions. (1) Predicted overpressure profiles where overburden is thick (dashed = URS-1B) and thin (solid = URS-3C). Overpressure at URS-3C is greater at the same depth than overpressures at URS-1B. (2) The effective stress ( v') is much lower at URS-3C than at URS-1B. (3) Porosities are much higher at URS-3C than URS-1B at equivalent depths. (4) Pore pressures (P) equal the overburden stress (v) at URS-3C. (5) Infinite slope analyses (FS; relates the failure-driving stress to the available shear strength for shallow failures) predict unstable conditions (FS < 1) for URS-3C. (6) Simulated vertical fluid velocity is higher at URS-3C than at URS-1B. At URS-1B we predict upward flow for most of the section but downward flow (velocity < 0) just above the aquifer. Model parameters: low permeability kv < 5 x 10–18 m2 and kh < 5 x 10–16 m2; aquifer permeability kh = kv 5 x 10–14 m2; maximum sedimentation rate = 3.5 mm/y; minimum sedimentation rate = 0.8 mm/y.