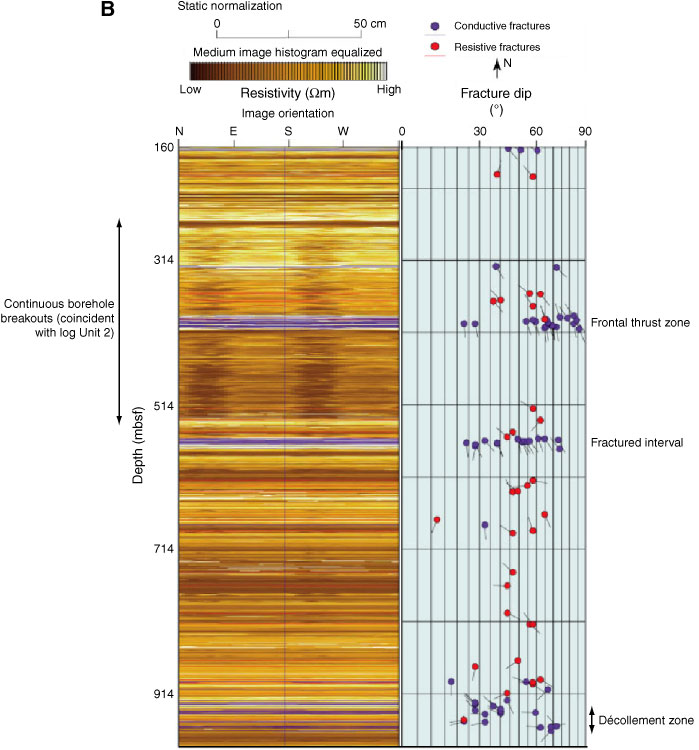
Figure F6 (continued). B. Resistivity-at-the-bit image from ODP Hole 808I, showing all interpreted fractures. Fractures are separated into conductive (blue) and resistive (red) fractures. Fracture orientations inferred from borehole breakout are dominantly northeast–southwest (dip directions northwest–southeast) within the fontal thrust zone and 560-mbsf fractured interval (Shipboard Scientific Party, 2002c).
Previous | Close | Next | Top of page