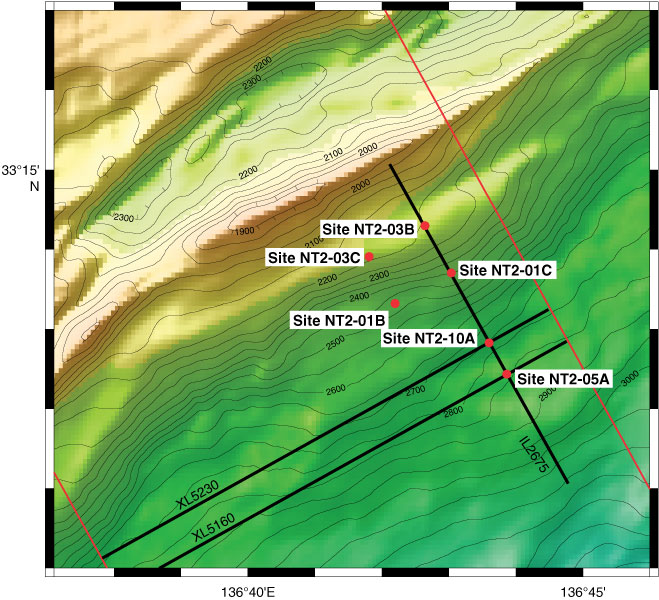
Figure F1. Seafloor bathymetry map (50 m contour interval) showing locations of proposed contingency Sites NT2-05A and NT2-10A and the seismic lines (black lines) displayed in Figures F2 and F3. Red circles = proposed holes, red lines = three-dimensional survey boundaries.
Close | Next | Top of page