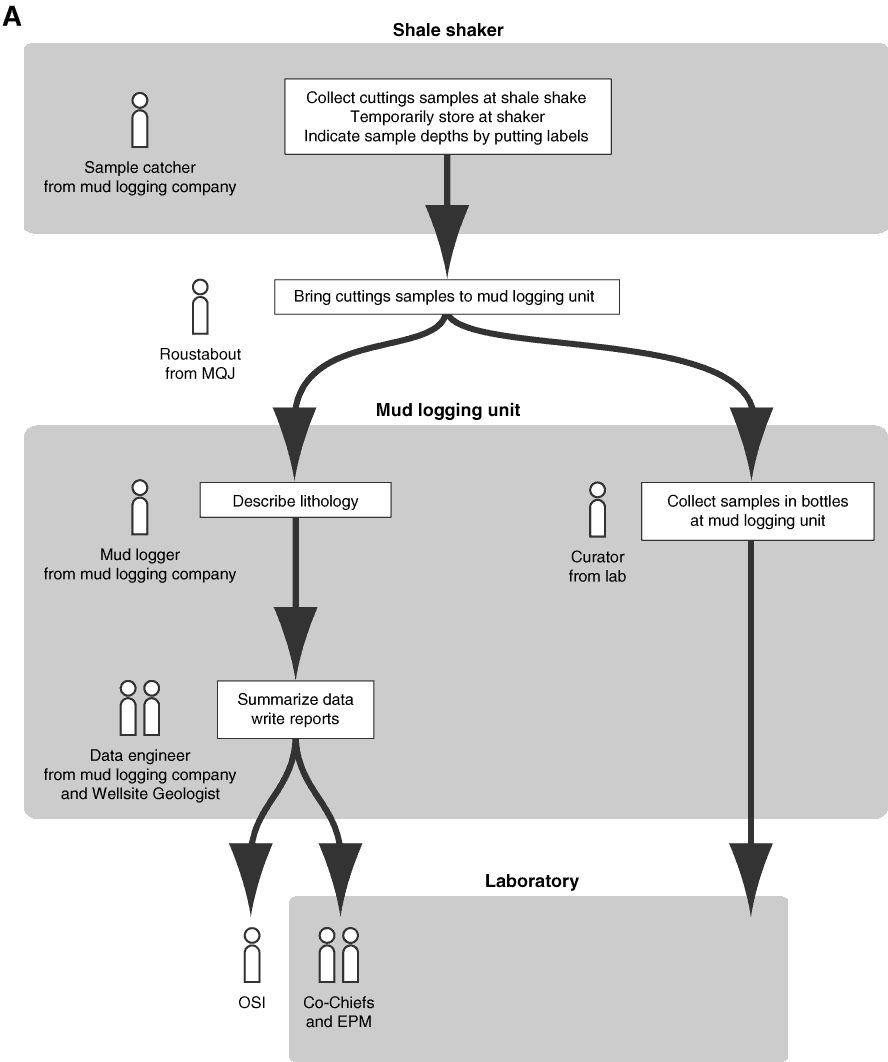
Figure F14. A. Personnel distribution and flow charts for the sampling and analysis of cuttings. Movement and splitting of samples from the shale shaker to the mud logging unit and science laboratory. Delivery of data reports to Operation Superintendent (OSI), Co-Chiefs, and Expedition Project Manager (EPM) is also shown. (Continued on next page.)

Previous | Close | Next | Top of page