Previous | Close | Next
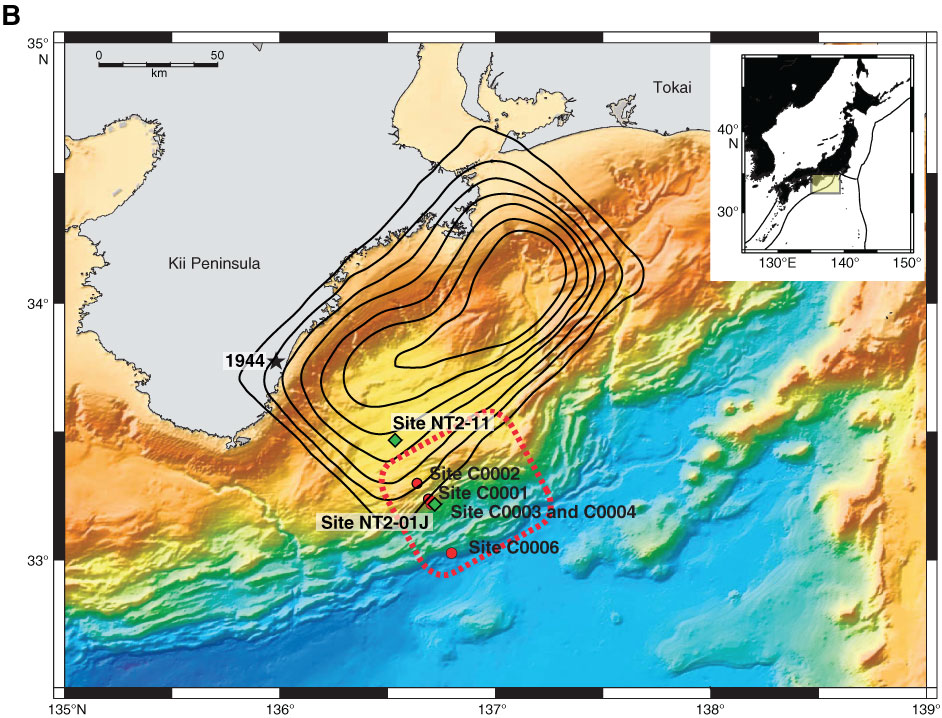
Figure F1 (continued). B. Map of drill sites and coseismic very low frequency earthquakes. Contours = slip during the 1944 event (0.5 m intervals), red box = region of recorded very low frequency earthquakes.
Previous | Close | Next | Top of page