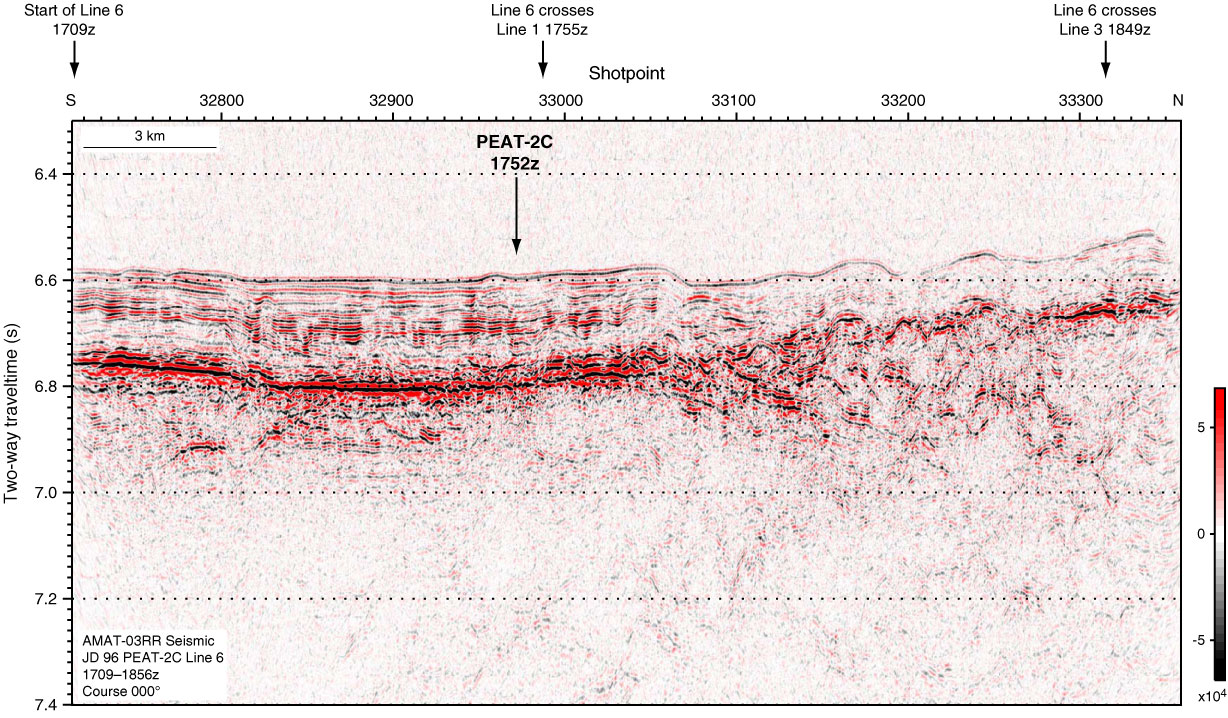
Figure F15. Seismic profile PEAT-2C Line 6 annotated in shotpoints, with position and penetration depth of Site PEAT-2C marked. Data are filtered, stacked, and migrated. Colors correspond to the relative amplitude of the seismic signal (black = lower amplitude, red = higher amplitude).
Previous | Close | Next | Top of page