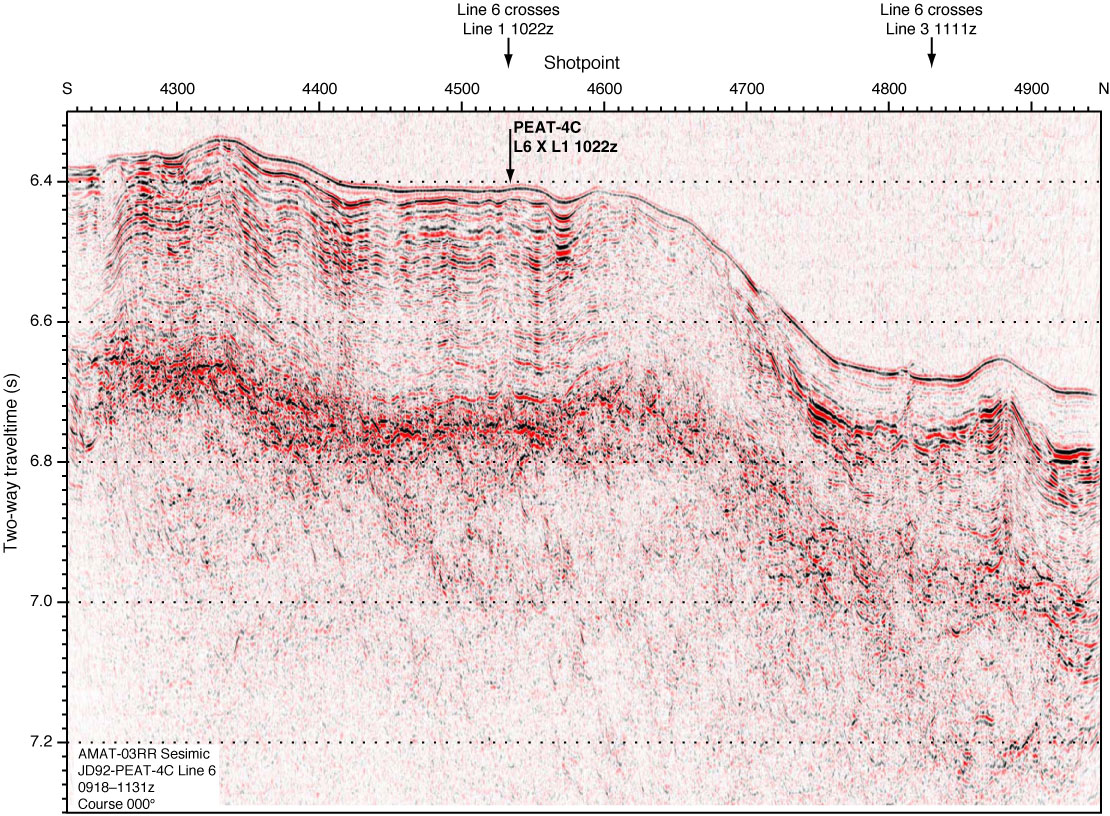
Figure F22. Cross seismic profile PEAT-4C Line 6 from AMAT-03 site survey, annotated in shotpoints. Data are stacked, filtered and migrated. The location of PEAT-4C is at the cross of Lines 1 and 6. Colors correspond to the relative amplitude of the seismic signal (black = negative amplitude, red = positive amplitude).
Previous | Close | Next | Top of page