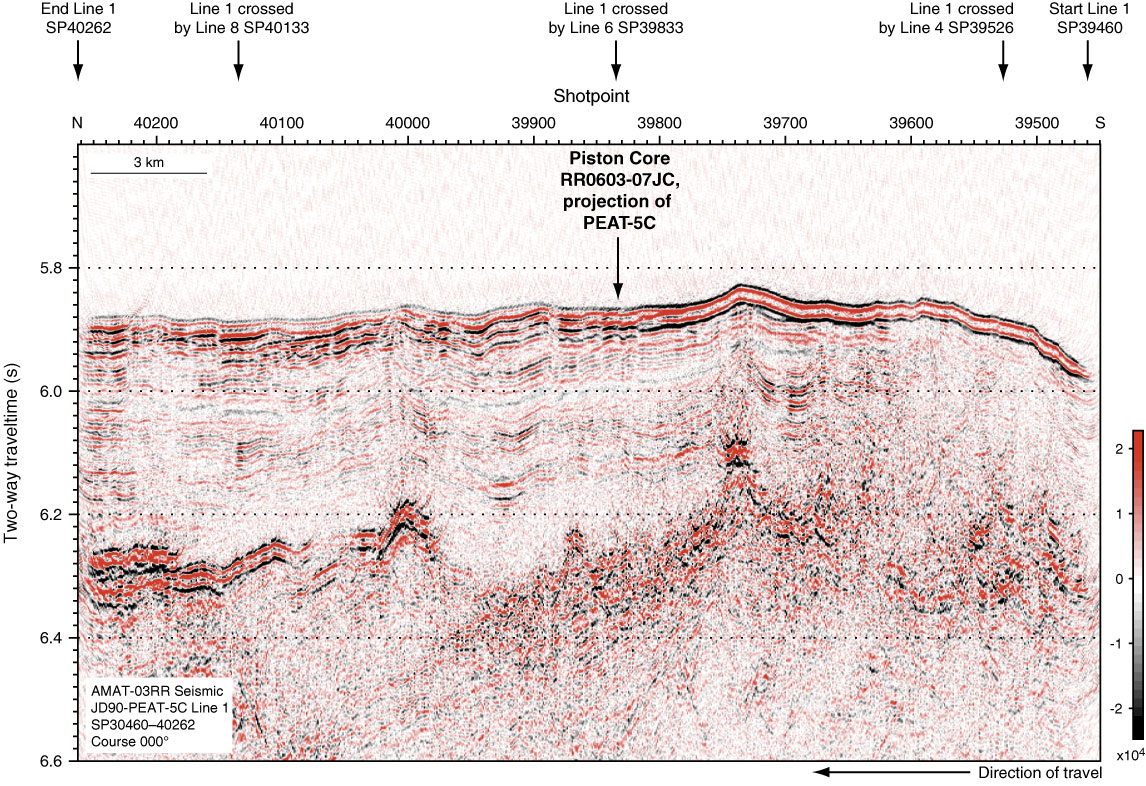
Figure F26. Crossline seismic profile PEAT-5C Line 1 from AMAT-03 site survey versus shotpoints. Site was moved west of the crossline to an area with better defined older seismic horizons. Colors correspond to the relative amplitude of the seismic signal (red = negative amplitude, black = positive amplitude).
Previous | Close | Next | Top of page