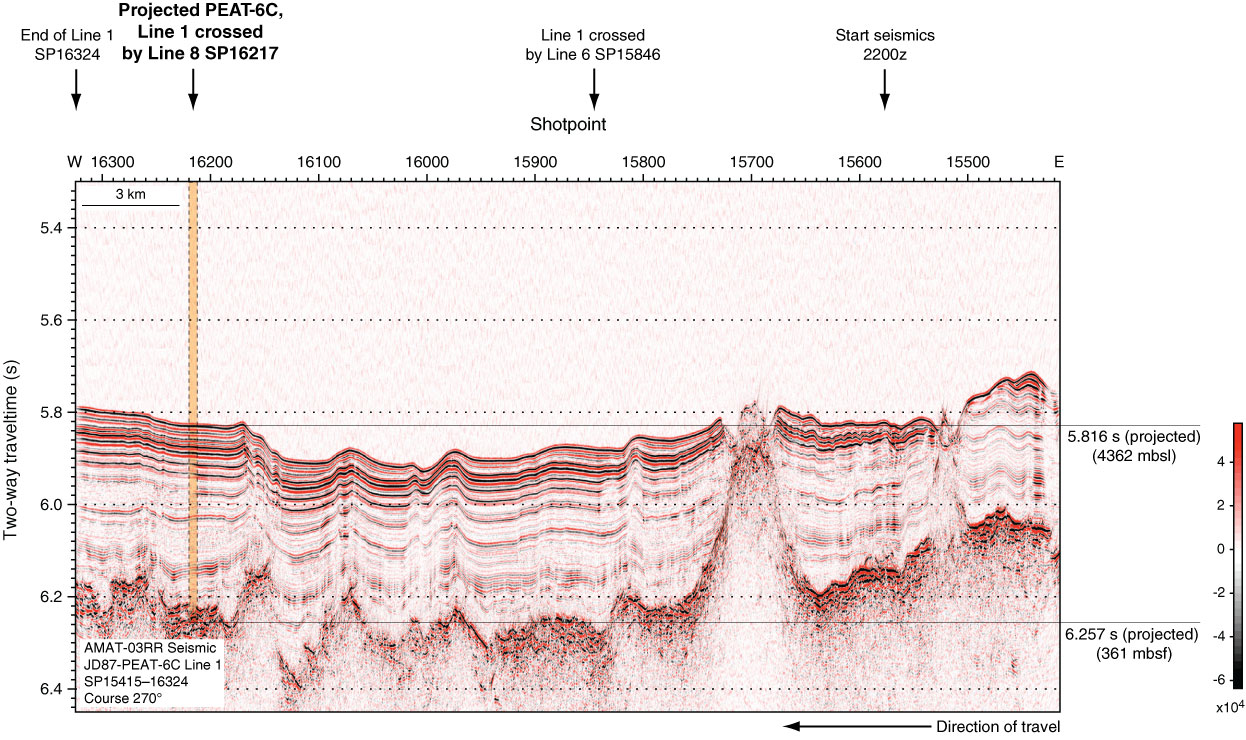
Figure F29. Crossline seismic profile PEAT-6C Line 1 from AMAT-03 site survey, annotated in shotpoints. Site was moved west of the crossline to avoid the basement deep. Colors correspond to the relative amplitude of the seismic signal (black = negative amplitude, red = positive amplitude).
Previous | Close | Next | Top of page