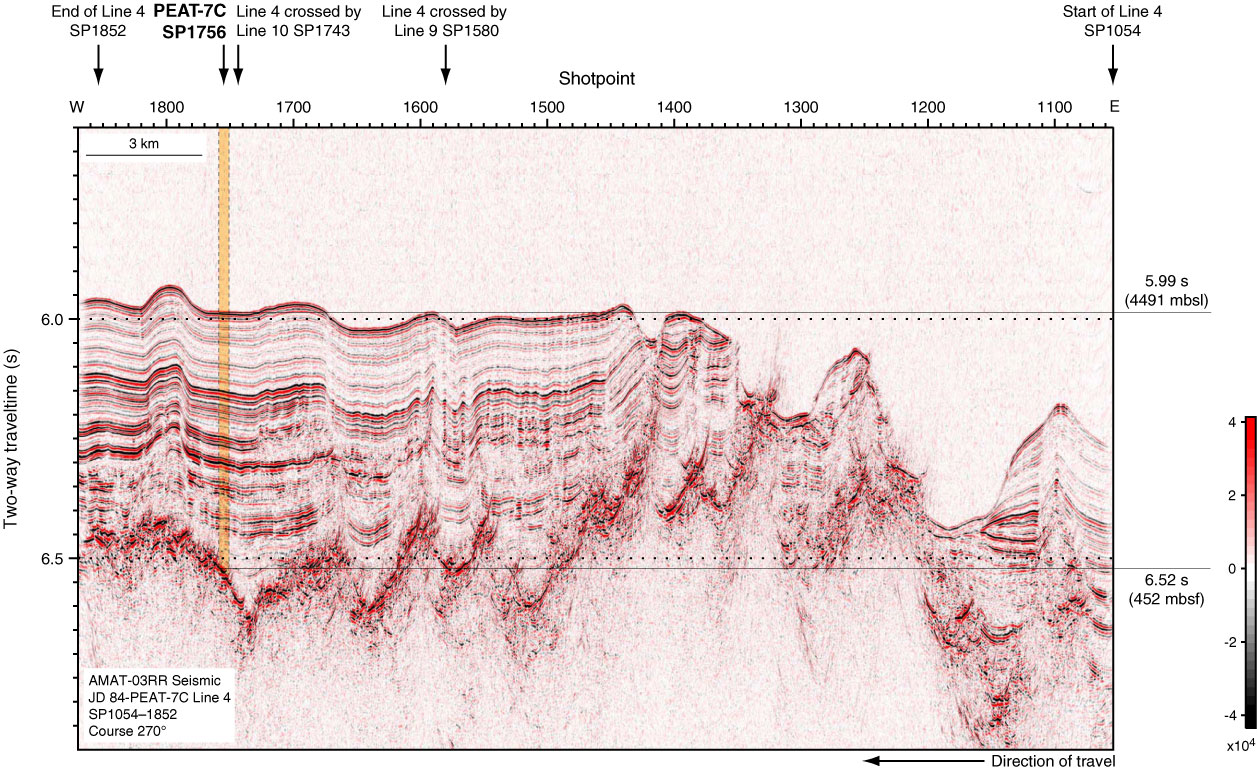
Figure F31. Seismic profile PEAT-7C Line 4 across PEAT-7C from AMAT-03 site survey, annotated in shotpoints. Proposed drill site is marked. Colors correspond to the relative amplitude of the seismic signal (black = negative amplitude, red = positive amplitude).
Previous | Close | Next | Top of page