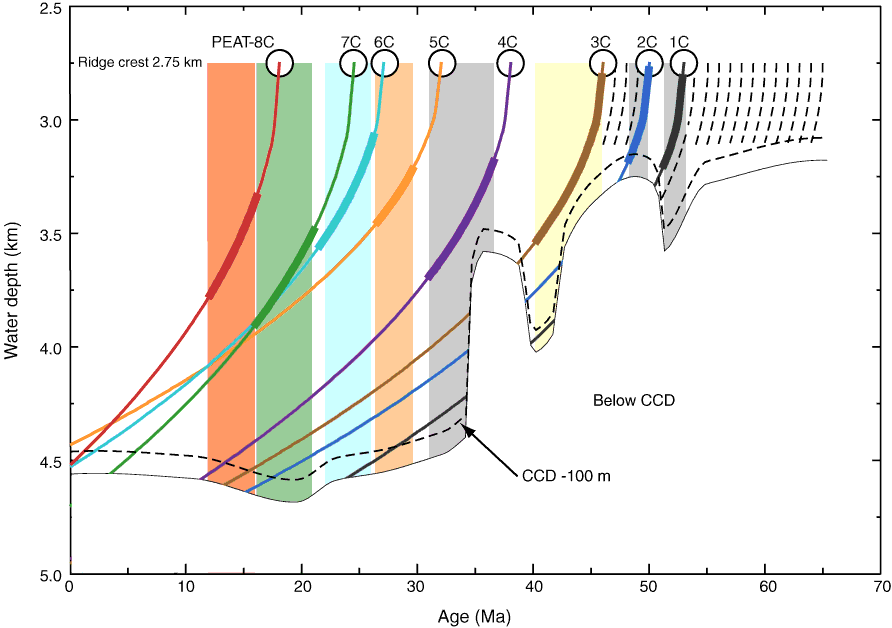
Figure F4. Targeting Pacific equatorial age transect (PEAT) drill sites based on the calcium compensation depth (CCD) history (van Andel, 1975), with new data from ODP Leg 199. Colored boxes represent the critical time interval targeted for each site. Subsidence curves use a subsidence parameter calculated from the estimated basement age of PEAT sites and their present-day depth (k = 0.35). Additional subsidence due to sediment loading was not modeled. Colored subsidence lines show the time interval when we expect carbonate to be deposited (i.e., when the site is above the CCD).
Previous | Close | Next | Top of page