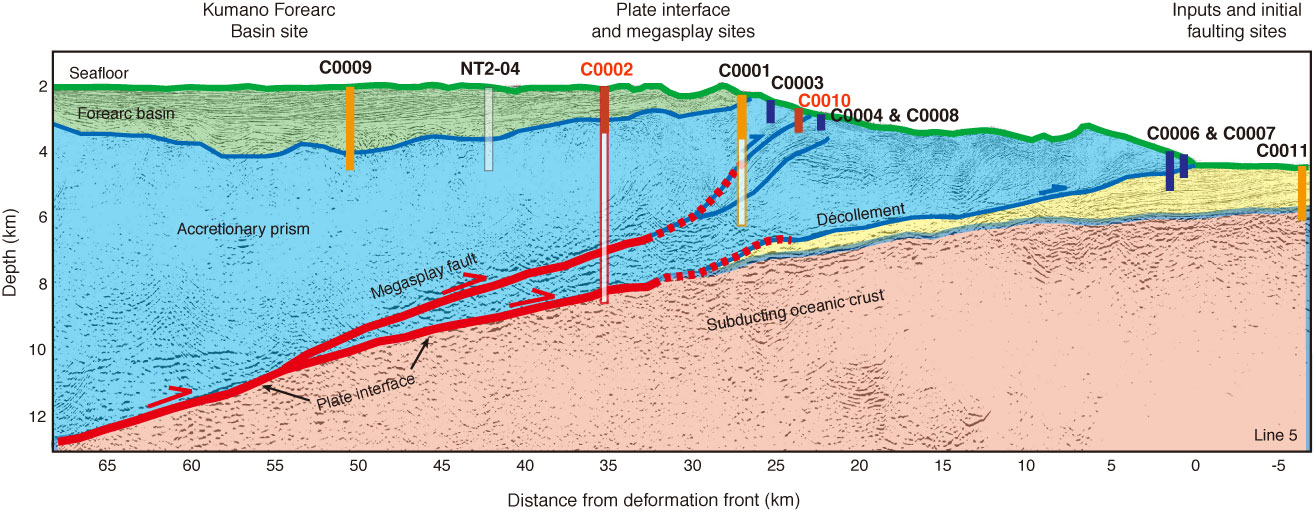
Figure F2. Seismic diagram at regional scale showing interpretation by Park et al. (2002) and drill sites. The updip of the megasplay fault is shown in relation to observatory Sites C0002 and C0010. Red = Sites C0002 and C0010, orange = sites drilled in 2009.
Previous | Close | Next | Top of page