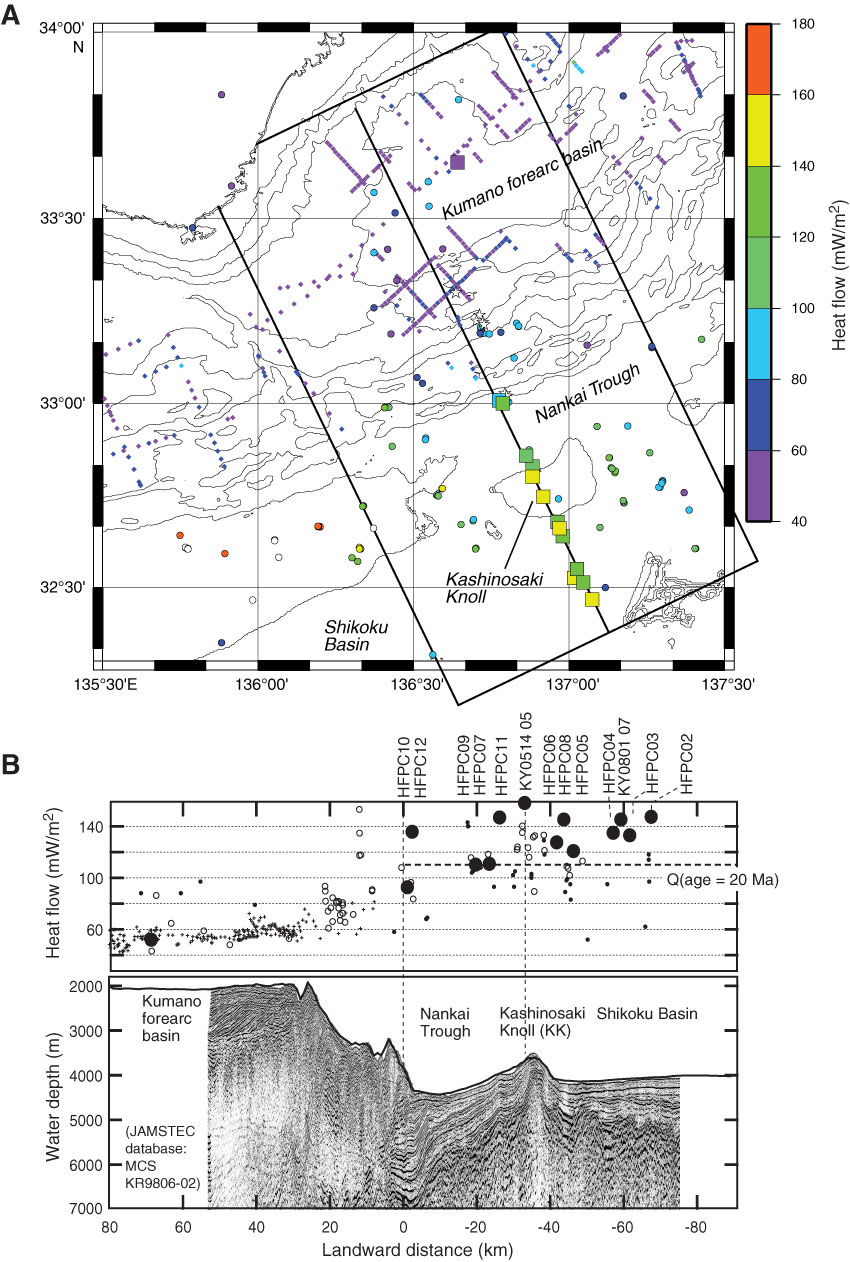
Figure F8. A. Heat flow distribution on the floor of the Nankai Trough plotted on area bathymetry. Heat flow values are indicated by the color code on the right. B. Heat flow distribution in the Nankai Trough off Kumano together with depth-converted multichannel seismic (MCS) profile. Dashed line = theoretical heat flow (110 mW/m2) corresponding to 20 Ma age ocean crust. Squares (in A) and large solid circles (in B) = heat flow values obtained during research Cruises KY03-14, KY07-01, and KY08-01 (Kinoshita et al., 2008a); small circles = other studies (Yamano et al., 2003; H. Hamamoto et al., unpubl. data); crosses = estimates from gas hydrate bottom-simulating reflectors (Ashi et al., 2002).
Previous | Close | Next | Top of page