Close | Next
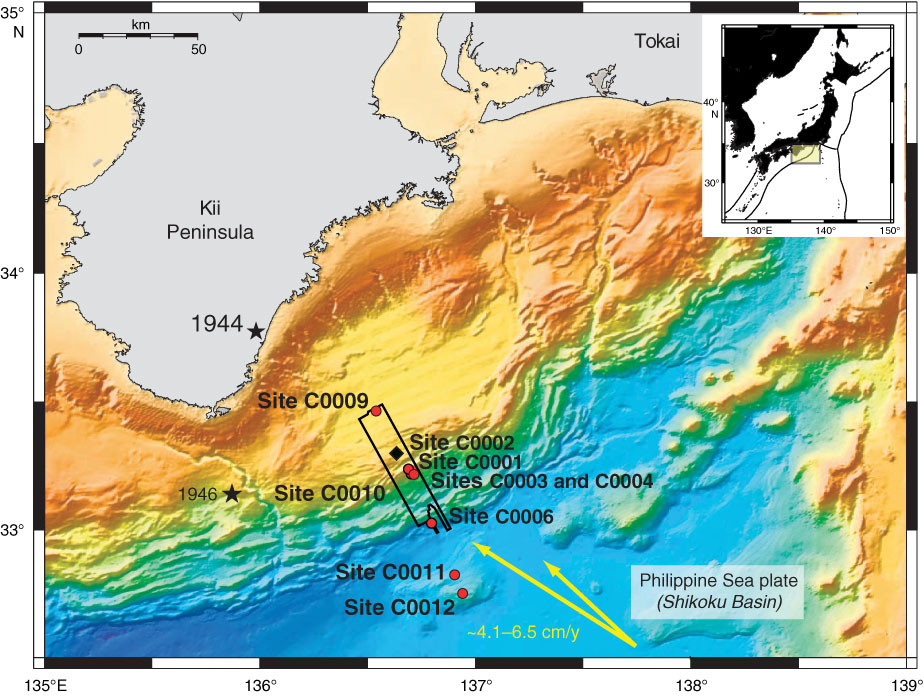
Figure F1. Map of NanTroSEIZE region, showing all Stage 1 and 2 sites. Box = region with 3-D seismic data, diamond = Expedition 338 site, circles = Stage 1 and 2 sites.
Close | Next | Top of page