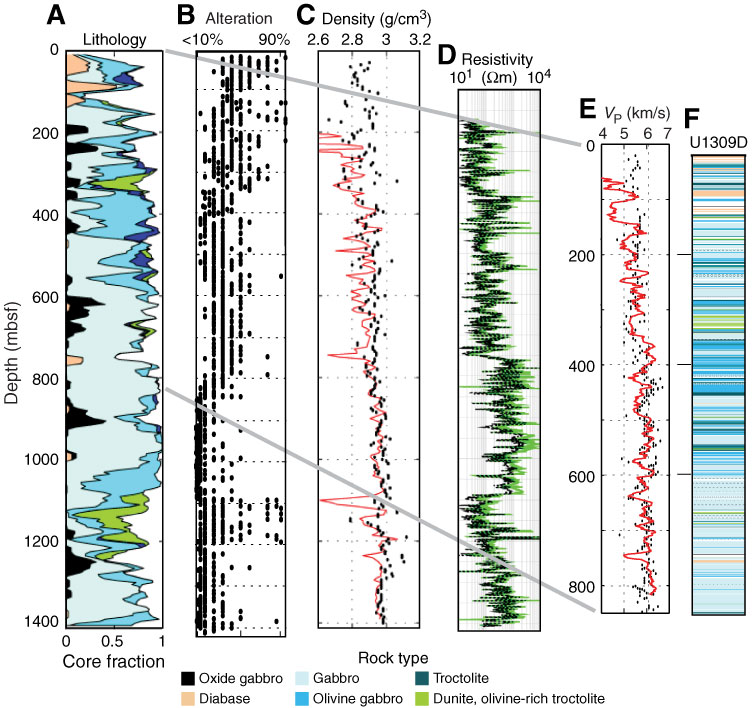
Figure F3. Downhole data, Hole U1309D. A. Lithology is dominantly gabbroic with intervals of greater olivine content. B. Alteration of core pieces determined by shipboard description. C. Density: red line = logged, black dots = shipboard core samples. D. Logs of wall rock resistivity. E. P-wave velocity: red line = logged, black dots = core sample at room temperature/pressure. F. Expanded lithology in uppermost 800 m where seismic data currently exist.
Previous | Close | Top of page