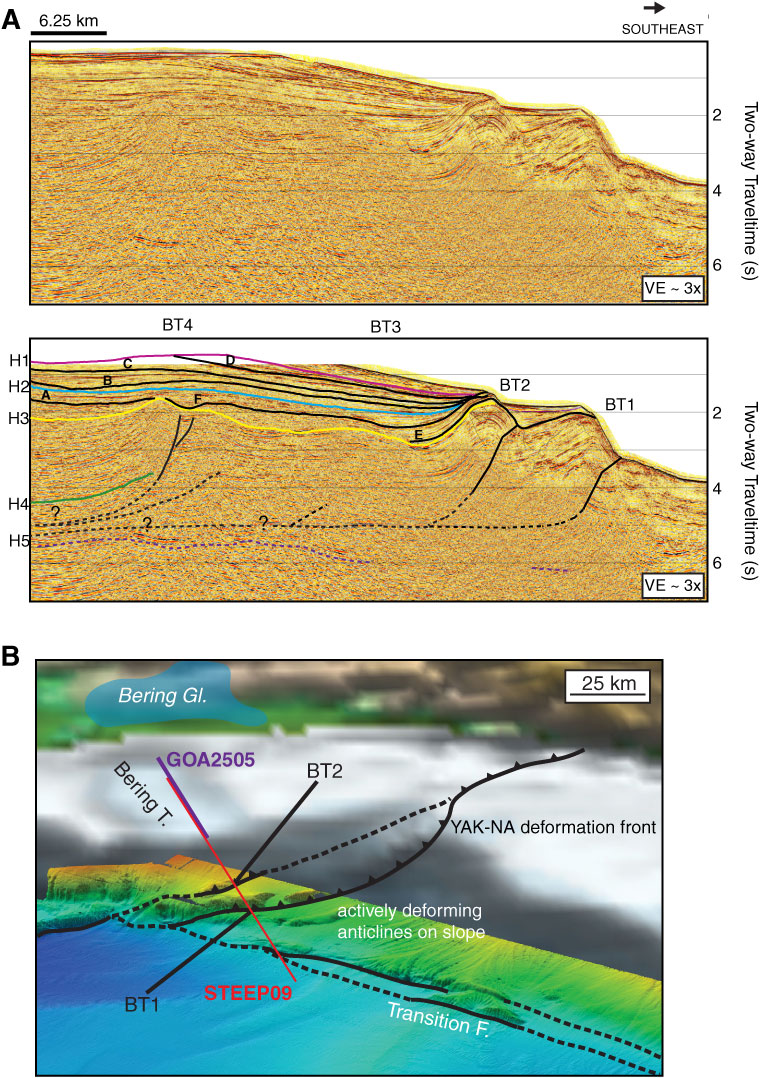
Figure F10. A. STEEP09 seismic section, uninterpreted (top) and interpreted (bottom). Interpreted section shows structures BT1, BT2, BT3, BT4, and key horizons. Colored horizons are regional horizons interpreted throughout the study area. Horizons A–F (black) are interpreted locally to define growth strata packages on fold limbs and glacial depositional sequences in the upper 2 s of the record. B. High-resolution (1002 m) bathymetry shows fault scarps on Yakutat slope associated with BT1 and BT2. Locations of seismic profiles STEEP09 (red) and GOA2505 (purple). From Worthington et al. (2010).
Previous | Close | Next | Top of page