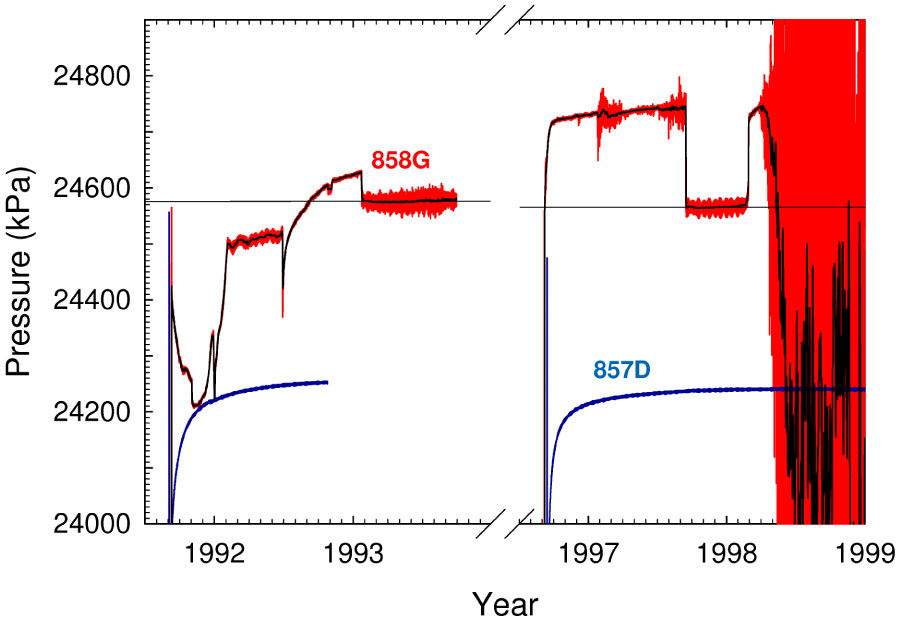
Figure F13. Early histories of pressure recording in Holes 857D and 858G following CORK installations during ODP Legs 139 and 169. Raw data are shown in blue and red; 1 day averaged data and seafloor hydrostatic pressures are shown in black for Hole 858G.
Previous | Close | Next | Top of page