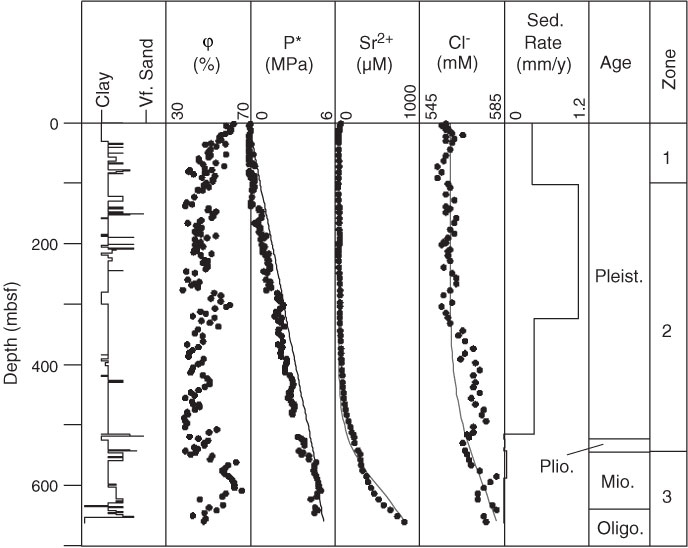
Figure F26. Core data from ODP Site 1073 (Fig. F23) (Austin, Christie-Blick, Malone, et al., 1998). Porosity was determined from wet and dry measurements of mass and volume of core samples. Values denoted by P* are overpressures predicted from porosity. The solid line on the P* plot is the reduced lithostatic stress (Sv – ρwgz). Pleistocene sedimentation rates far exceed Miocene and Pliocene sedimentation rates, as inferred from biostratigraphic data. Modified from Dugan and Flemings (2002). Vf. = very fine.
Previous | Close | Top of page