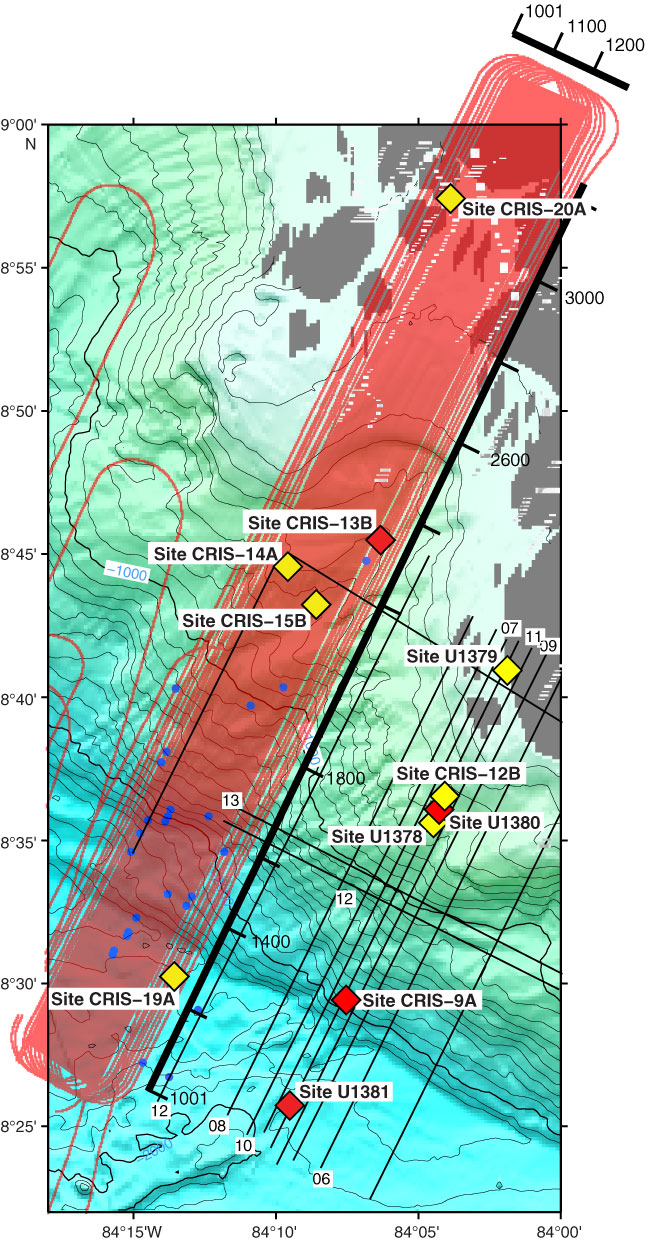
Figure AF1 (continued). B. Map of MGL1106 3-D seismic survey with proposed CRISP sites. Red diamonds = primary sites, yellow diamonds = alternate sites, red lines = 3-D seismic survey, black lines = seismic reflection lines (see Fig. AF1A), blue circles = xbt drops. The numbers along the short and long axis of the 3-D survey represent inlines and xlines, respectively.

Previous | Close | Next | Top of page