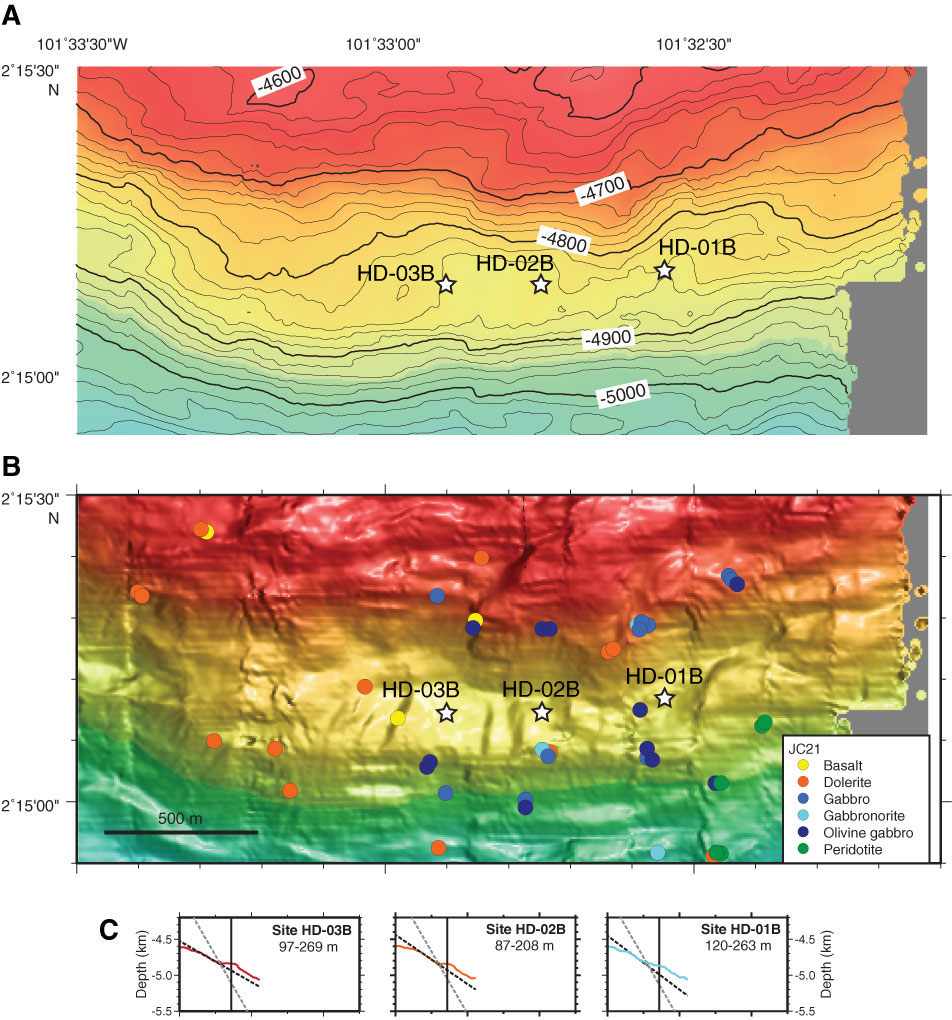
Figure F8. A. Contoured microbathymetry map of the sedimented bench in the vicinity of the drill sites. B. Illuminated microbathymetry map of the sedimented bench showing the location of the drill sites and rock types for samples recovered by the ROV Isis (MacLeod et al., unpubl. cruise report, 2008). Contour interval = 20 m. C. Three north–south seafloor depth profiles centered at each drill site. We assume that the slope above the bench is the footwall of a normal fault that projects beneath the bench. The depth of the normal fault beneath the center of the bench (listed on each panel) is constrained in two ways: (1) the upper slope is projected beneath the bench–—this constrains the minimum depth of the fault below the bench, and (2) a slope of 60° (i.e., expected slope of a normal fault prior to erosion) is projected beneath the bench—this constrains the maximum depth of the fault below the bench (120–263 mbsf at proposed Site HD-01B; 87–208 mbsf at proposed Site HD-02B; 97–269 mbsf at proposed Site HD-03B). Map prepared by D. Shillington and V. Ferrini.
Previous | Close | Next | Top of page