Previous | Close | Next
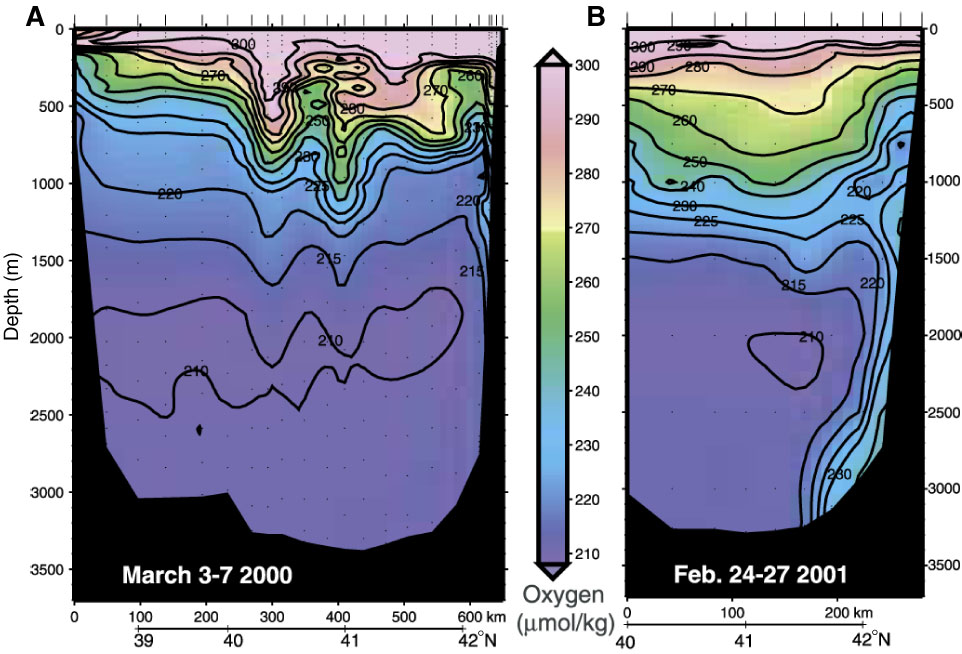
Figure F13. A, B. Graphic representations of oxygen content along 131°–300°E. Episodic formation of Japan Sea Proper Water sinking to the bottom of the Japan Sea during severe winter of 2001 is shown in B.
Previous | Close | Next | Top of page