Previous | Close | Next
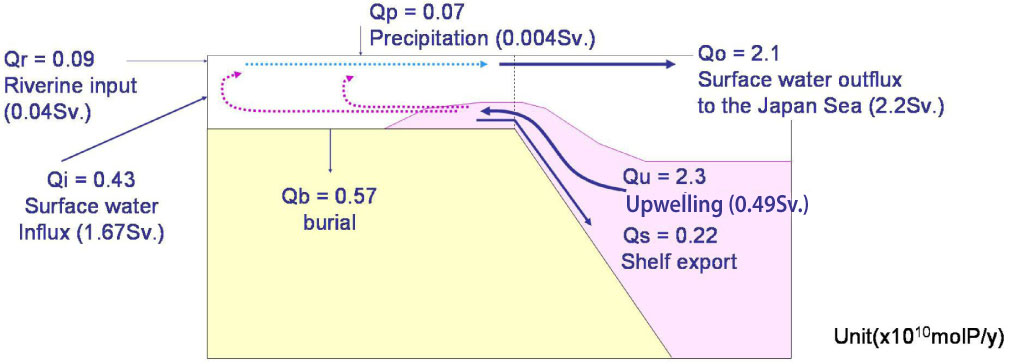
Figure F5. Diagram of phosphorus (Q) and water (in parentheses) budgets in the northern part of the East China Sea shelf and its margin. Modified from Chen and Wang (1999).
Previous | Close | Next | Top of page