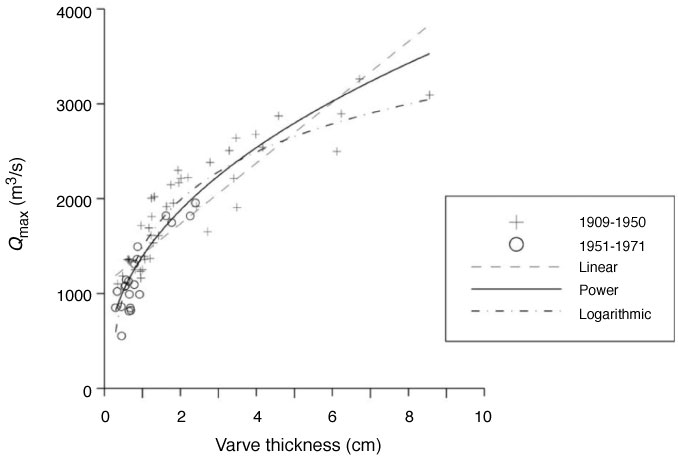
Figure F4. Scatter plot of varve thickness (cm) versus Qmax (m3/s) for the 1909–1971 period. Qmax for the regulated period is shown by open circles and for the unregulated period by crosses. The three equations, linear, power, and logarithmic, are fitted by a least sum of squares to the data set (see fig. 5 in Sander et al., 2002).
Previous | Close | Next | Top of page