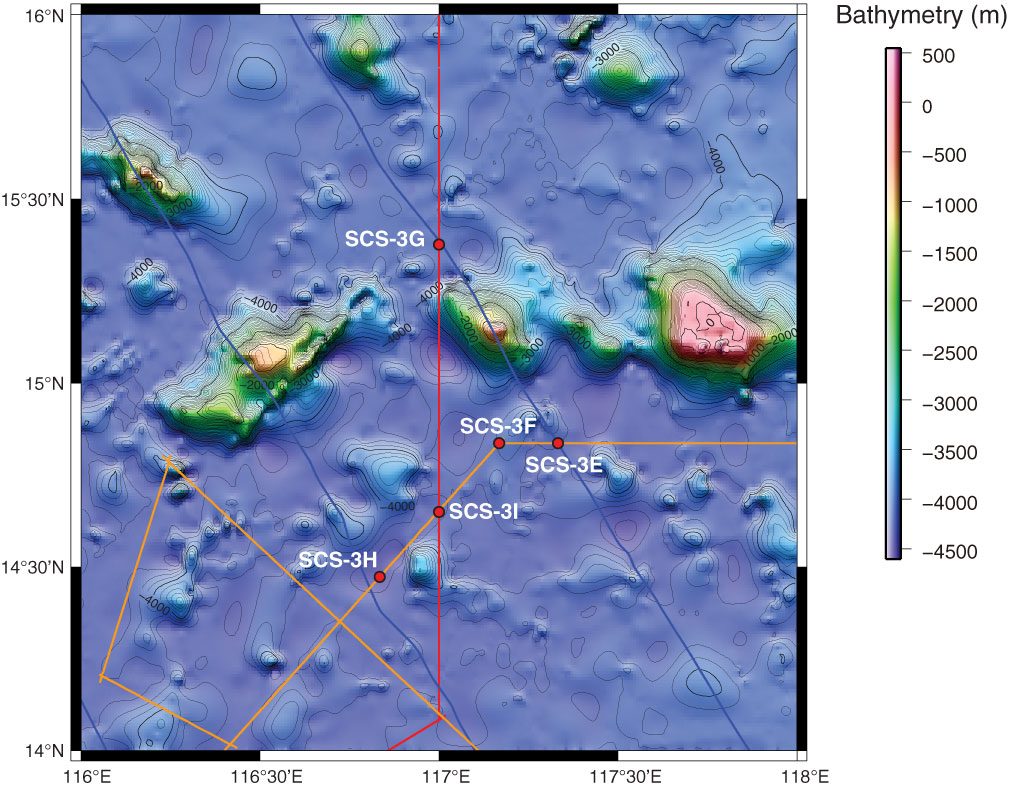
Figure AF10. Regional contoured bathymetric map showing seismic reflection profiles (orange and red lines) and the locations of primary Site SCS-3G, backup primary Site SCS-3F, and alternate Sites SCS-3E, SCS-3H, and SCS-3I. Contour interval = 1000 m.
Previous | Close | Next | Top of page