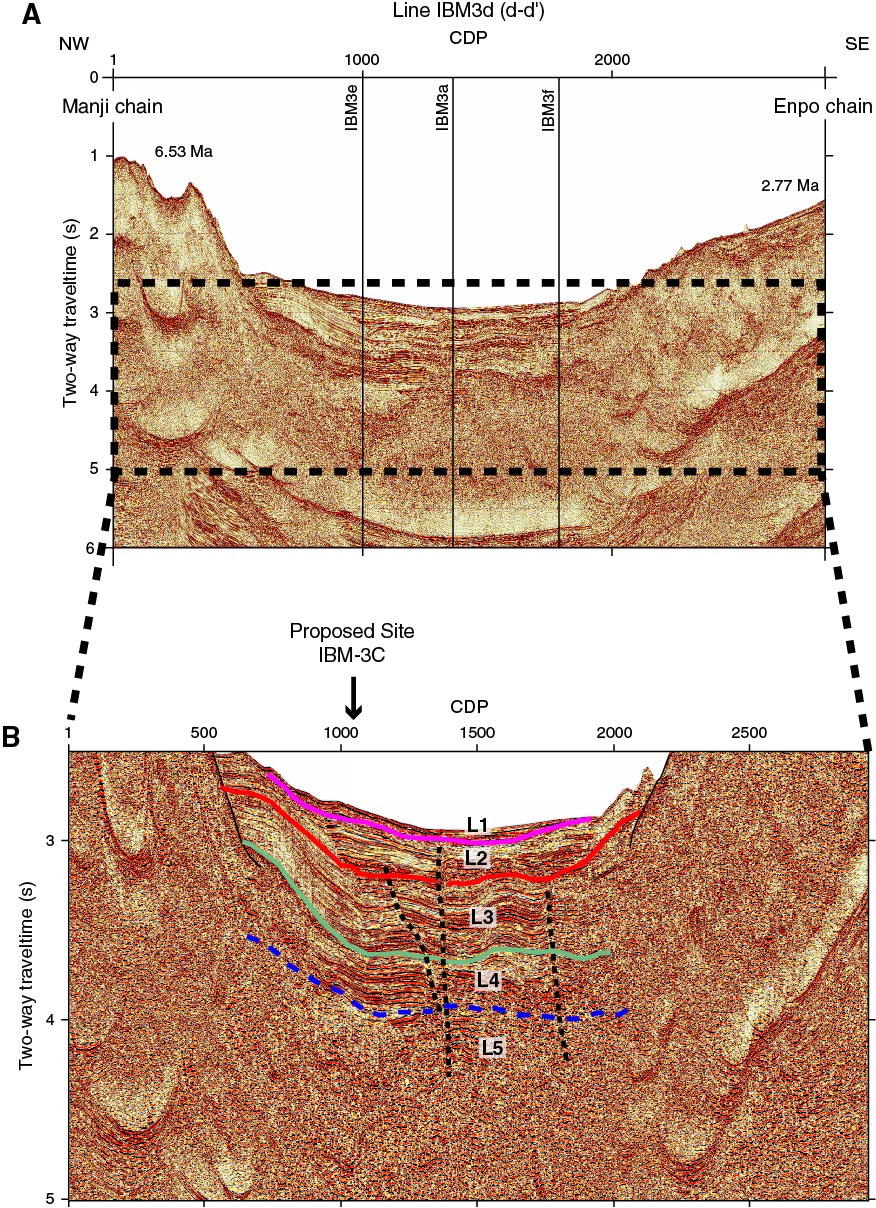
Figure F10. Seismic profile Line IBM3d. CDP = common depth point. A. Uninterpreted data. B. Interpretation of expanded profile around proposed Site IBM-3C. Pink, red, green, and blue lines = boundaries between seismic Layers L1–L5. Black dotted lines = faults. Black solid lines = the edge of the seamounts around proposed Site IBM-3C.
Previous | Close | Next | Top of page