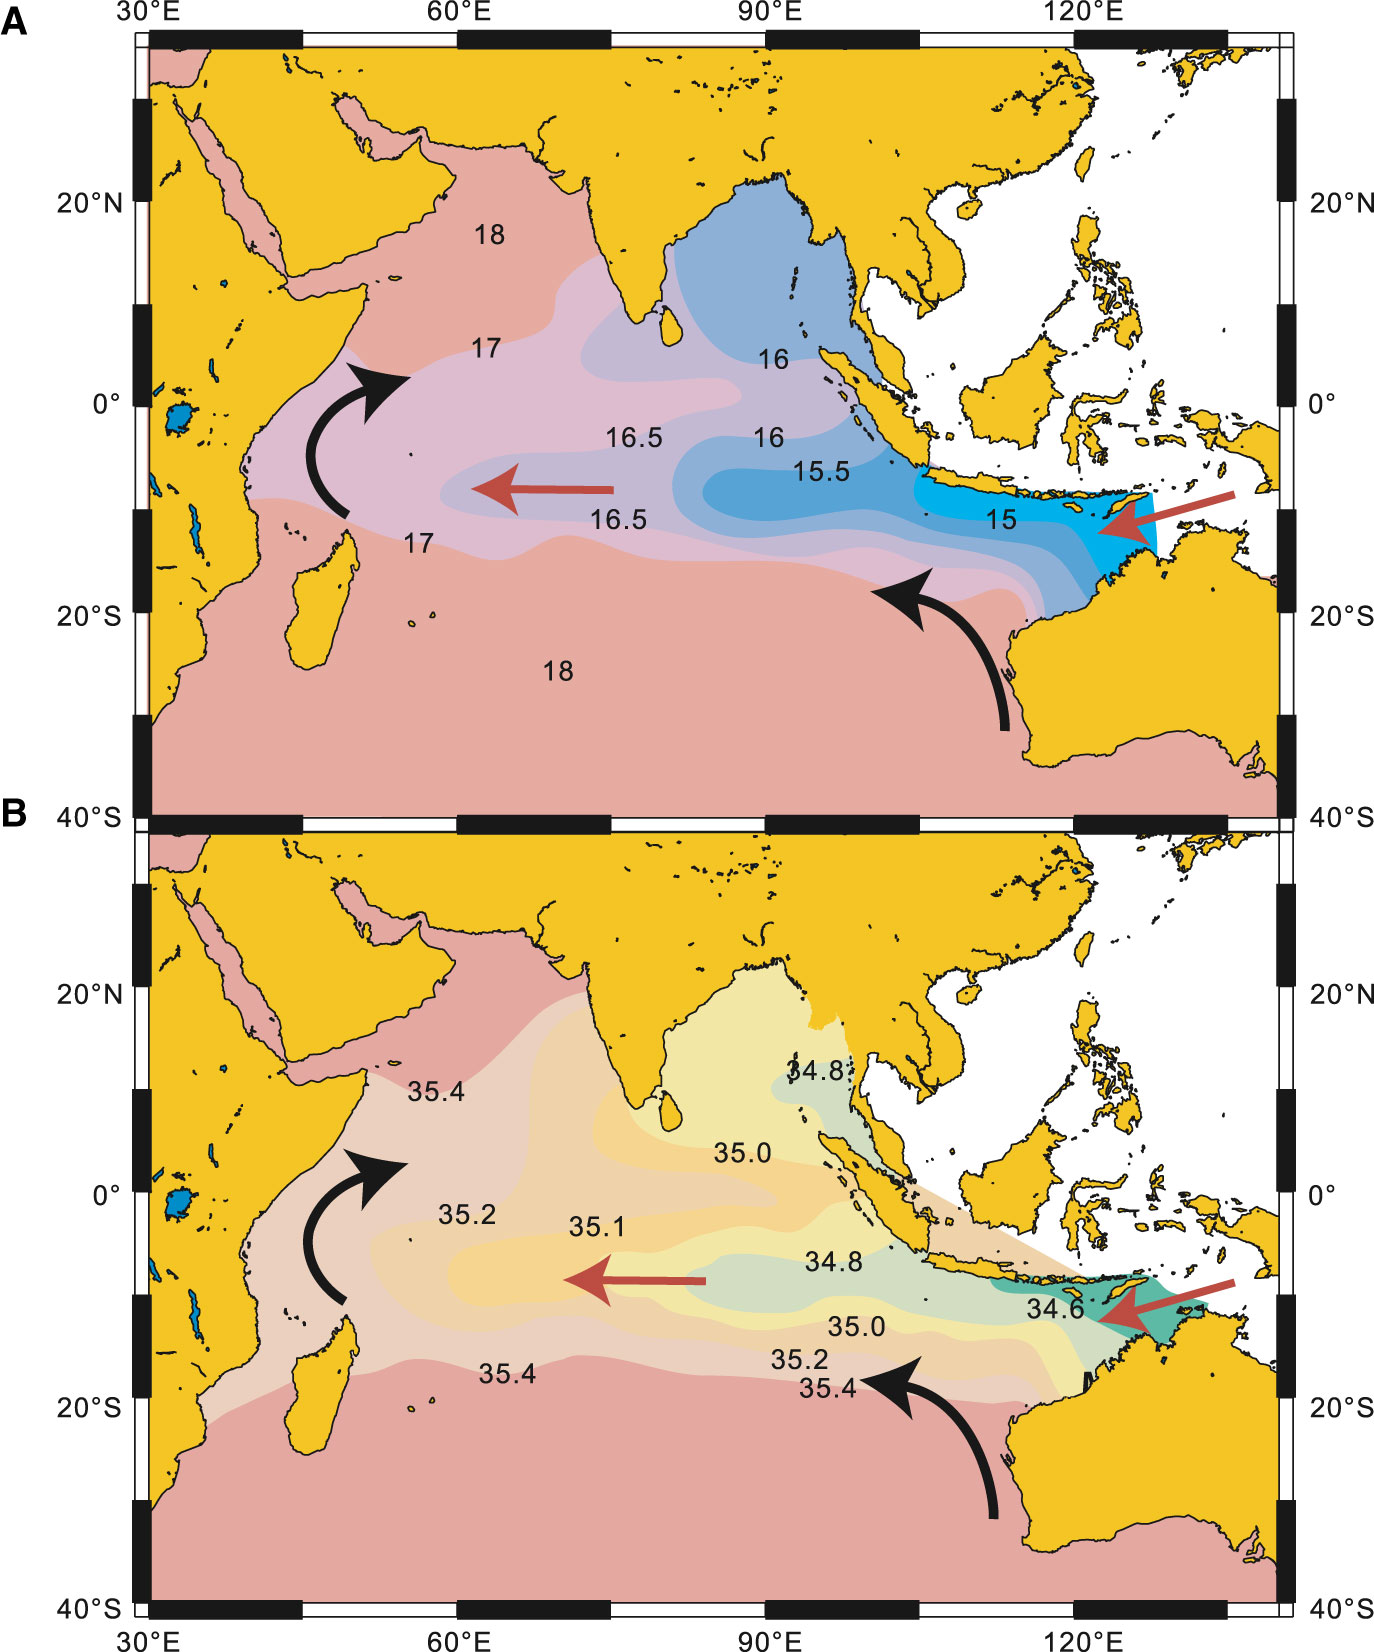
Figure F13. Mean (A) temperature (°C) and (B) salinity (psu) in the upper thermocline on isopycnal Surface 25.7, located in the depth range 150–200 m (after You and Tomczak, 1993). Arrows indicate movement of Indian Central Water (black) and Indonesian Throughflow Water (red). From Xu et al. (2006).

Previous | Close | Next | Top of page