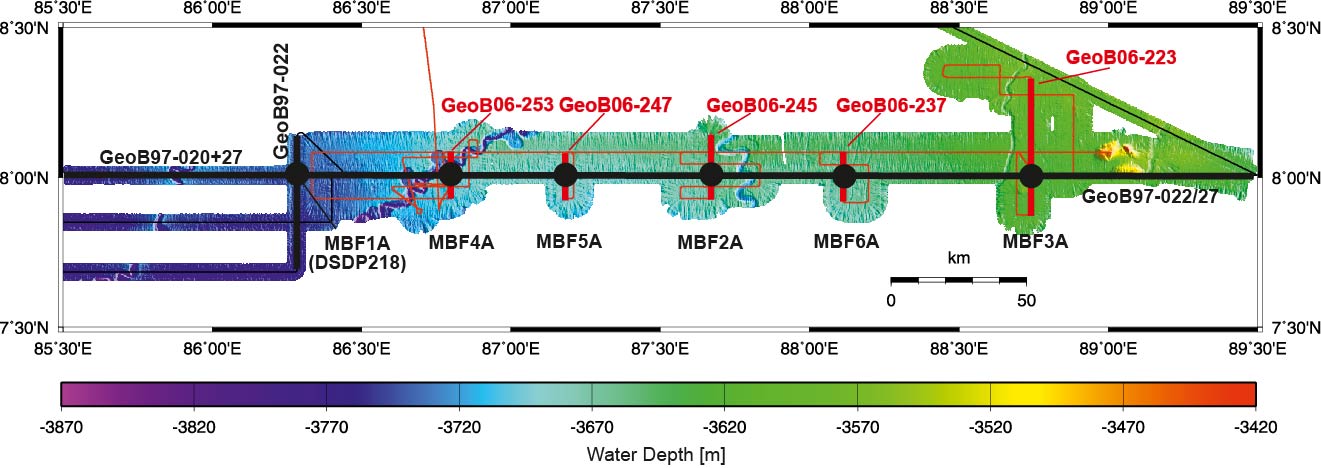
Figure AF1. Bathymetric map showing the seafloor around Sites MBF-1A–MBF-6A. Data were gathered with a Hydrosweep DS system during Cruise SO125 (1997) and a Simrad EM120 system during Cruise SO188 (2006). Data are processed and gridded using a node size of 150 m. Black = seismic profiles shot during Cruise SO125, red = seismic profiles shot during Cruise SO188. Profiles crossing the drill sites are highlighted and annotated.
Close | Next | Top of page