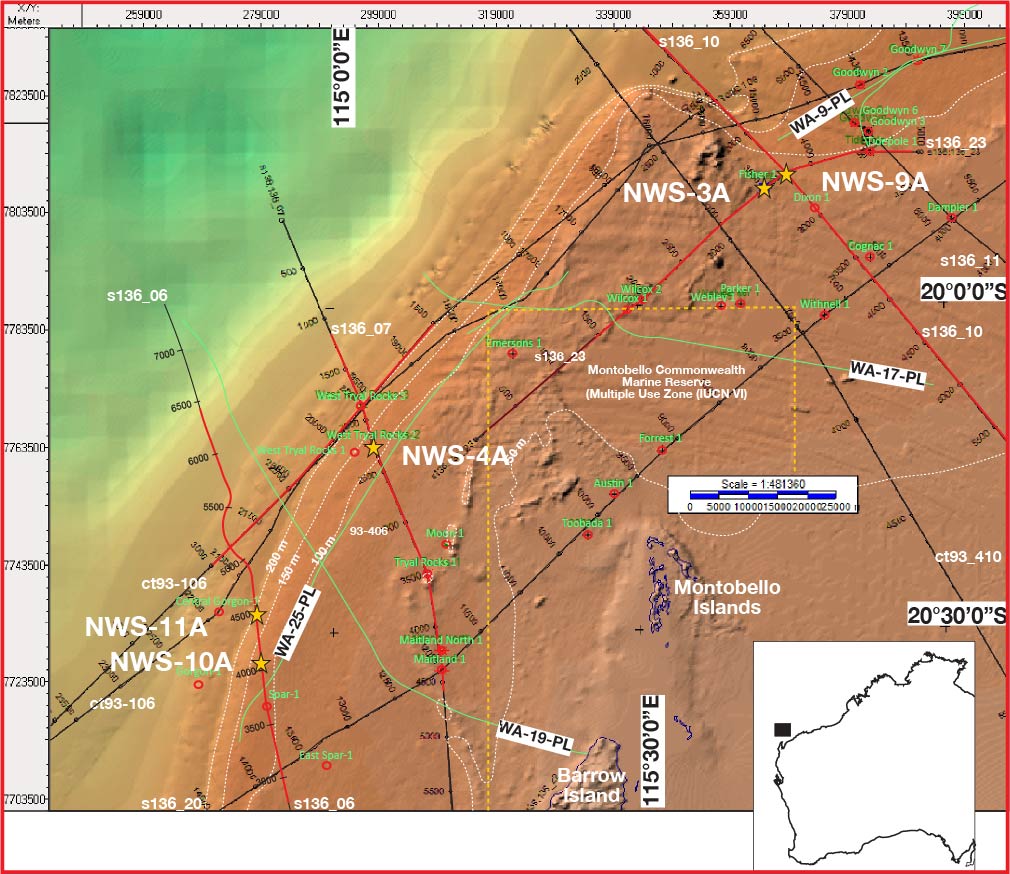
Figure AF6. Bathymetric map showing the seafloor around primary Sites NWS-3A and NWS-4A and alternate Sites NWS-9A, NWS-10A and NWS-11A. Bathymetric data are derived from the Geoscience Australia Australian bathymetry and topography grid, June 2009. The positions of multichannel seismic profiles are shown. Green lines indicate positions of gas pipelines.
Previous | Close | Next | Top of page