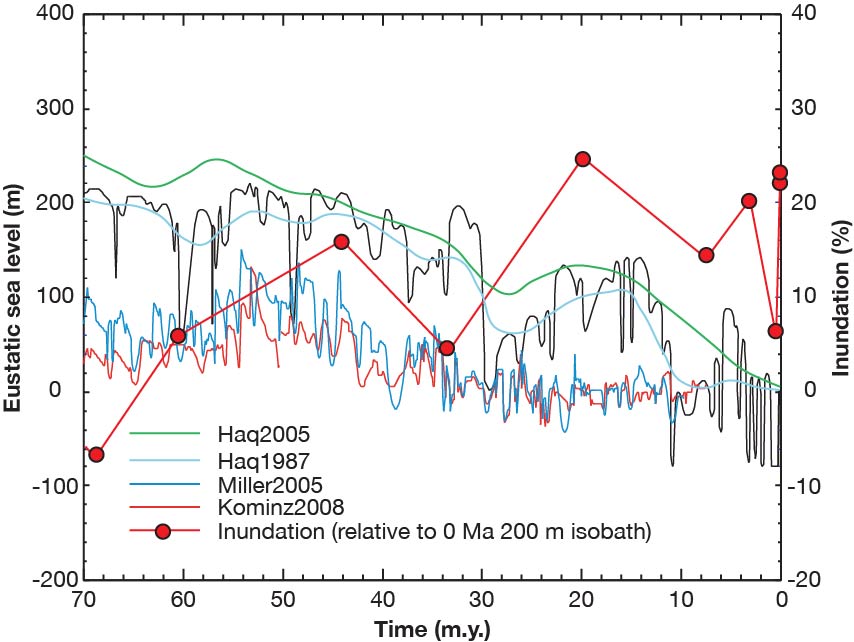
Figure F9. Global sea level (eustatic) curves and inundation history of the Australian continent based on paleoshorelines (Isern et al., 1995). Green curve = filtered global sea level curve (Haq and Al-Qahtani, 2005), black curve = global sea level curve (Haq et al., 1987), thick light blue line = filtered curve. Filtered lines show the long-wavelength component of the eustatic estimate using a cosine arch filter with a 10 m.y. window. Other curves include the Miller et al. (2005) and Kominz et al. (2008) sea level curves. All curves are plotted using the Gradstein et al. (2012) timescale. The amount of inundation is computed relative to the present-day 200 m isobath from the ETOPO2 global 2¢ topography (NOAA, National Geophysical Data Center, 2006). Adapted from Heine et al. (2010).
Previous | Close | Top of page