Next Section | Table of Contents
doi:10.2204/iodp.pr.308.2005
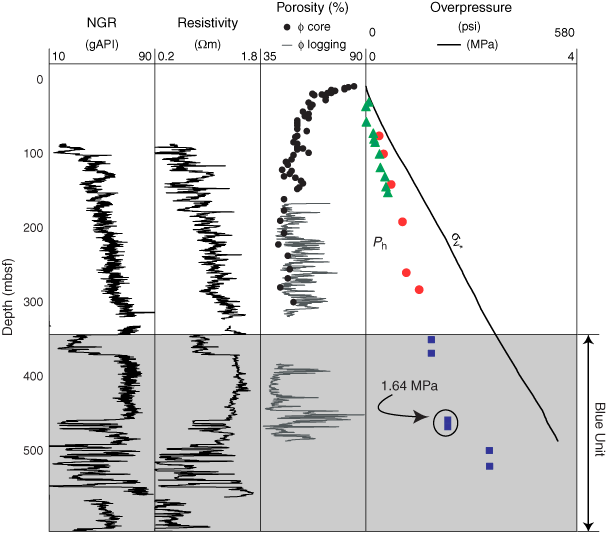
Figure F10. Gamma ray (NGR) and resistivity logs, core and log porosities, and in situ pressures at M.C. 810 Ursa geotechnical well #1. The Blue Unit (light gray) lies between 300 and 550 mbsf and is composed of interbedded sandstone and mudstone layers. Core porosity ( core) declines rapidly with depth to 200 mbsf and thereafter is constant. Overpressure (P* = P – Ph) is plotted; thus the vertical axis is hydrostatic pressure (Ph) and the right boundary of the plot is the reduced lithostatic pressure (
 v* =
v* =  v – Ph). Circles = piezoprobe pressures, triangles = preconsolidation pressures from uniaxial consolidation tests of core, stars = pressure measurements inferred from pressure while driling (PWD) in the Blue Unit. Ostermeier et al. (2000) and Eaton (1999) further describe these data.
