Next Section | Table of Contents
doi:10.2204/iodp.pr.308.2005
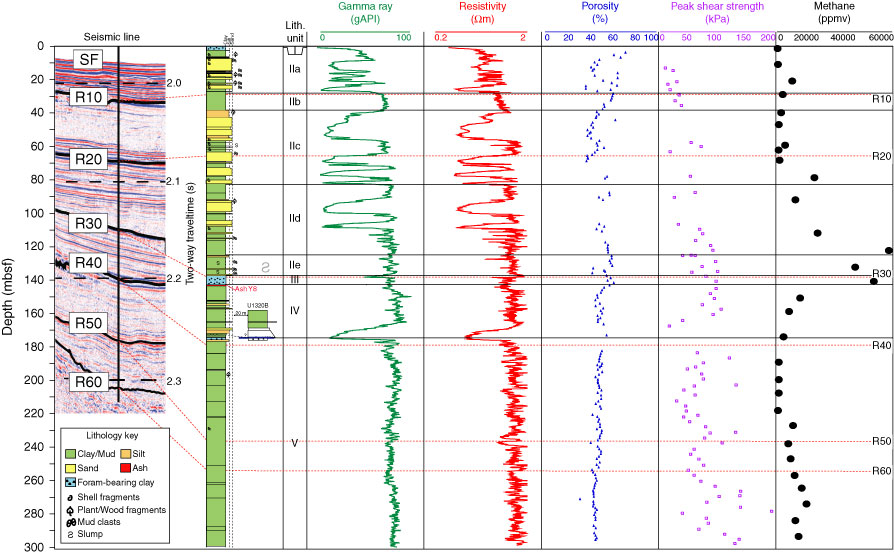
Figure F14. Combination diagram showing seismic strip chart, the lithologic column with lithostratigraphic units deduced from core description, downhole variations of gamma ray intensity and resistivity, porosity, experimentally determined peak shear strength, and headspace methane contents at Site U1320. The time-depth correlation was achieved by converting wireline logs in time using the check shots obtained in Hole U1320A.