Next Section | Table of Contents
doi:10.2204/iodp.pr.308.2005
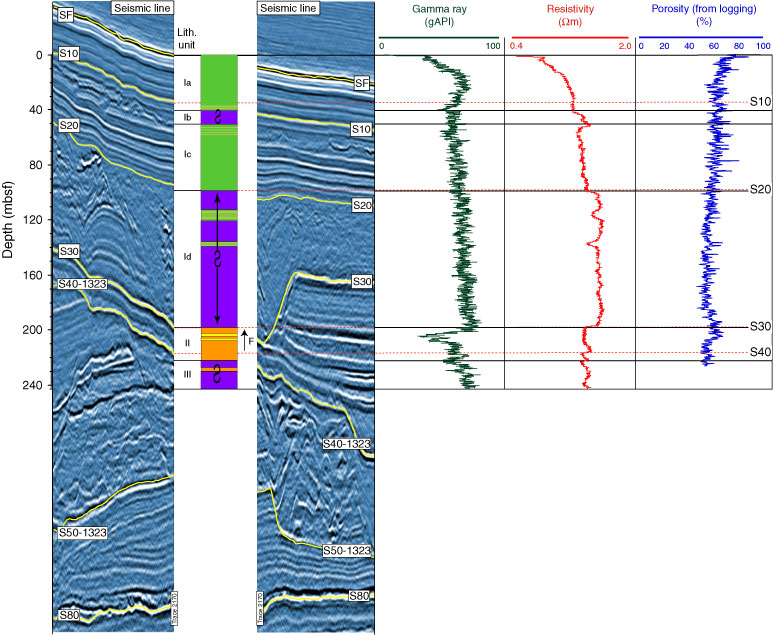
Figure F17. Combination diagram showing seismic strip chart, the lithological column interpreted from the logging data, downhole variations of gamma ray intensity and resistivity, and log porosity at Site U1323.