Next Section | Table of Contents
doi:10.2204/iodp.pr.311.2005
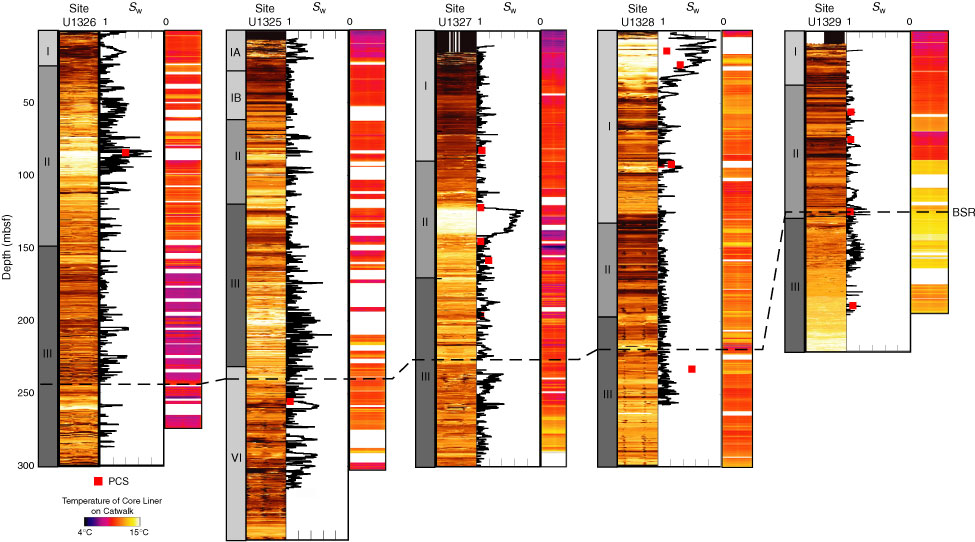
Figure F28. Summary of Expedition 311 compressed infrared images of core liner temperature. Also shown are lithostratigraphic units, LWD resistivity-at-the-bit (RAB) images, pore water saturation (Sw), and location of the bottom-simulating reflector (BSR). PCS = pressure core sampler.