Next Section | Table of Contents
doi:10.2204/iodp.pr.312.2006
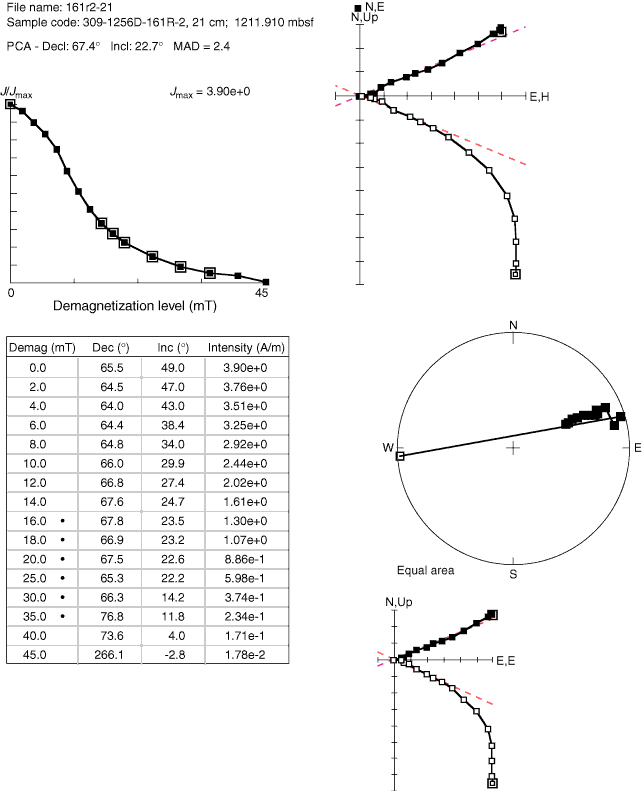
Figure F54. AF demagnetization behavior of one of the most stable samples studied (discrete Sample 309-1256D-161R-2, 21–23 cm). Normalized intensity versus demagnetization level is at upper left; component diagrams and direction plots are on the right. Dots on the data table and double squares on the intensity plot = values used for principal component analysis (PCA), with results listed at top left. High demagnetization (Demag) fields are required to reduce the intensity, and inclination (Inc) changes at progressive demagnetization steps are smaller than for other samples. MAD = maximum angular deviation, Dec = declination.